
| Symbol | Last | Change | % | High | Low |
|---|---|---|---|---|---|
| USD / JPY | 161.88 | -0.68 | -0.42% | 162.60 | 161.36 |
| Open Last Trade : 07:03 | GMT Time : Thu Jul 02 2026 07:04 | ||||
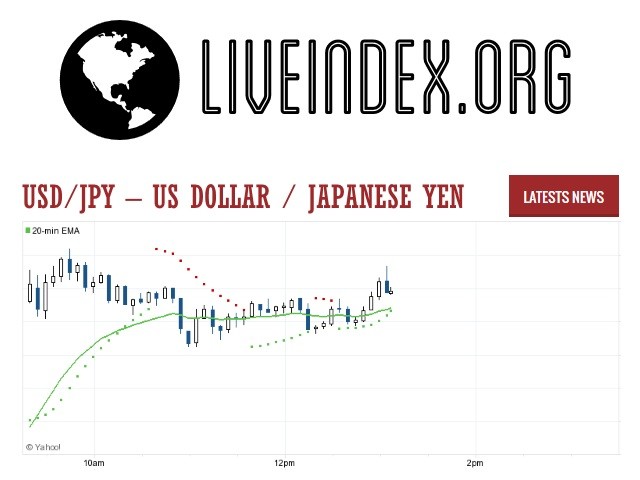
USD/JPY : Intraday Live Chart
USD/JPY : Technical Signal Buy & Sell
| 5 Min Signal | 1 Hour Signal | 1 Day Signal |
|---|---|---|
| Sell | Sell | Buy |
USD/JPY : Moving Averages
| Period | MA 20 | MA 50 | MA 100 |
|---|---|---|---|
| 5 Minutes | 162.20 | 162.35 | 162.44 |
| 1 Hour | 162.49 | 162.50 | 162.16 |
| 1 Day | 161.24 | 160.03 | 159.41 |
| 1 Week | 158.38 | 154.45 | 152.51 |
USD/JPY : Technical Resistance Level
| Resistance 1 - R1 | Resistance 2 - R2 | Resistance 3 - r3 |
|---|---|---|
| 162.63 | 162.68 | 162.71 |
USD/JPY : Technical Support Level
| Support 1 - S1 | Support 2 - S2 | Support 3 - S3 |
|---|---|---|
| 162.55 | 162.52 | 162.47 |
USD/JPY : Periodical High, Low & Average
| Period | High Change from Last | Low Change from Last | Average Change from Last |
|---|---|---|---|
| 1 Week | 162.64 -0.76 | 0.00 +161.88 | 162.02 -0.14 |
| 1 Month | 162.64 -0.76 | 0.00 +161.88 | 160.93 +0.95 |
| 3 Month | 162.64 -0.76 | 0.00 +161.88 | 159.45 +2.43 |
| 6 Month | 162.64 -0.76 | 0.00 +161.88 | 158.11 +3.77 |
| 1 Year | 162.64 -0.76 | 0.00 +161.88 | 154.33 +7.55 |
USD/JPY : Historical Chart
Related News


USD/JPY Exchange Rate: A Century of Fluctuations and Economic Shifts
The USD/JPY exchange rate remains one of the most important and liquid currency pairs in the global forex market. Representing the relationship between the U.S. dollar and the Japanese yen, it is a key barometer of economic health, trade balances, and central bank policy in two of the world’s largest economies. From post-WWII rebuilding to the Plaza Accord and modern-day monetary easing, the journey of the dollar-yen pair is a story of dramatic highs and lows shaped by powerful macroeconomic forces.
Post-War Stabilization and the Bretton Woods Era (1945–1971)
Japan’s post-war economy was closely tied to the U.S. dollar through the Bretton Woods system, under which exchange rates were fixed. The yen was pegged at 360 per dollar from 1949 until the early 1970s. This stable exchange rate helped Japan rebuild its economy by promoting exports, giving rise to the country’s industrial boom.
The system began to unravel as trade imbalances grew. The U.S. was running large deficits, while Japan’s trade surplus ballooned. In 1971, President Nixon suspended the dollar’s convertibility to gold, effectively ending Bretton Woods. Soon after, the yen was allowed to float, marking the beginning of its appreciation era.
Yen Strengthens Amid Economic Rise (1970s–1980s)
During the 1970s, the yen appreciated steadily against the dollar due to Japan’s booming economy and growing trade surplus. The oil crises of 1973 and 1979 pushed up inflation worldwide, but Japan’s efficient manufacturing sector weathered the shocks well, increasing investor confidence in the yen.
By the 1980s, Japan had become an economic powerhouse. However, tensions with the U.S. flared over trade imbalances. In 1985, the Plaza Accord was signed by major economies, including the U.S. and Japan, to deliberately devalue the dollar. This led to a sharp yen appreciation — from around 240 yen per dollar in 1985 to 120 by 1988 — doubling its value in just three years.
The Asset Bubble and “Lost Decades” (1990s–2000s)
Japan’s asset bubble burst in the early 1990s, plunging the country into a prolonged period of deflation and stagnant growth. As a result, the Bank of Japan (BOJ) adopted ultra-loose monetary policy well ahead of global peers, including zero interest rates and later quantitative easing.
Throughout the 1990s and 2000s, the yen remained relatively strong, often trading between 110 and 135 per dollar, driven by Japan’s current account surplus and global demand for yen as a safe haven. However, occasional interventions by the BOJ attempted to weaken the currency to support exports.
The 2008 global financial crisis also led to a stronger yen due to its haven status, with the rate falling below 90 yen per USD by early 2009 — a level that heavily strained Japanese exporters.
Abenomics and Renewed Dollar Strength (2010s)
In 2012, Prime Minister Shinzo Abe introduced an aggressive policy known as Abenomics, which included massive monetary stimulus, structural reforms, and fiscal spending. The BOJ’s bond-buying programs expanded rapidly, causing a significant weakening of the yen.
From 2012 to 2015, the USD/JPY rate rose from 80 to over 125, marking a major shift in currency dynamics. This helped Japanese exports and boosted inflation, which had remained persistently low.
During the second half of the 2010s, the pair mostly traded between 100 and 115, as the Fed began to normalize interest rates, while Japan continued easing. Currency volatility was somewhat suppressed due to global synchronized growth and accommodative central bank policies.
Pandemic Impact and Diverging Central Bank Paths (2020s)
The COVID-19 pandemic disrupted global financial markets, leading to sharp currency movements. Initially, the yen strengthened during the crisis due to its safe-haven status, pushing the rate below 103 yen per USD in 2020.
However, from 2021 onwards, the landscape shifted. The Federal Reserve began aggressive rate hikes to combat rising inflation in the U.S., while the BOJ maintained ultra-low rates and yield curve control (YCC). This divergence in monetary policy led to a sharp depreciation of the yen, pushing the USD/JPY rate to a 32-year high of around 151 yen per dollar in 2022.
Despite Japan’s efforts to defend the yen through currency interventions in late 2022 and 2023, the divergence remained. As of April 2025, the rate sits around 151.29, hovering near multi-decade highs as markets expect the BOJ to eventually tighten, albeit cautiously.
USD/JPY Exchange Rate by Decade
The following table highlights the average USD/JPY exchange rates per decade along with directional trends and key macroeconomic context:
| Decade | Avg. USD/JPY Rate | Change vs. Prior Decade | Key Economic Highlights |
|---|---|---|---|
| 1950s | 360.00 (fixed) | — | Bretton Woods, post-WWII recovery |
| 1970s | 270.00 | 🔴 -25.0% | End of Bretton Woods, oil shocks |
| 1980s | 190.00 | 🔴 -29.6% | Plaza Accord, yen appreciation |
| 1990s | 120.00 | 🔴 -36.8% | Japan’s lost decade, BOJ easing |
| 2000s | 110.00 | 🔴 -8.3% | Globalization, safe haven flows |
| 2010s | 105.00 | 🔴 -4.5% | Abenomics, BOJ QE expansion |
| 2020s* | 135.00 | 🟢 +28.6% | COVID-19, Fed hikes, BOJ YCC |
*2020s data current as of April 2025
🟢 = USD Strengthened vs JPY | 🔴 = USD Weakened vs
USD/JPY - US Dollar / Japanese Yen Currency Rate
Live Price of USD/JPY. USD/JPY Live Chart, Intraday & Historical Live Chart, Buy Sell Signal, USD/JPY News, USD/JPY Averages, Returns & Historical Data
» USD/JPY
» USD/JPY Real Time Quotes
» USD/JPY Live Chart
» USD/JPY Intraday Chart
» USD/JPY Historical Chart
» USD/JPY Buy Sell Signal
» USD/JPY News
» USD/JPY Videos
» USD/JPY Averages
» USD/JPY Currency Pair
» USD/JPY Historical Data