
| Symbol | Last | Change | % | High | Low |
|---|---|---|---|---|---|
| DOW FUTURES | 52,171.0 | +98.0 | +0.19% | 52,326.0 | 52,035.0 |
| Open Last Trade : 08:47 | US Time : Tue Jul 21 2026 08:47 | ||||
Dow 30 Futures : Intraday Live Chart
Dow 30 Futures : Technical Signal Buy & Sell
| 5 Min Signal | 1 Hour Signal | 1 Day Signal |
|---|---|---|
| Sell | Sell | Buy |
Dow 30 Futures : Moving Averages
| Period | MA 20 | MA 50 | MA 100 |
|---|---|---|---|
| 5 Minutes | 52218.48 | 52242.25 | 52238.89 |
| 1 Hour | 52192.14 | 52297.25 | 52355.14 |
| 1 Day | 52799.00 | 52055.67 | 50815.00 |
| 1 Week | 49788.23 | 48241.88 | 45447.48 |
Dow 30 Futures : Technical Resistance Level
| Resistance 1 - R1 | Resistance 2 - R2 | Resistance 3 - r3 |
|---|---|---|
| 52,129.0 | 52,176.0 | 52,214.0 |
Dow 30 Futures : Technical Support Level
| Support 1 - S1 | Support 2 - S2 | Support 3 - S3 |
|---|---|---|
| 52,044.0 | 52,006.0 | 51,959.0 |
Dow 30 Futures : Periodical High, Low & Average
| Period | High Change from Last | Low Change from Last | Average Change from Last |
|---|---|---|---|
| 1 Week | 52,938.0 -767.0 | 52,035.0 +136.0 | 52,519.1 -348.1 |
| 1 Month | 53,440.0 -1,269.0 | 51,712.0 +459.0 | 52,625.4 -454.4 |
| 3 Month | 53,440.0 -1,269.0 | 48,776.0 +3,395.0 | 51,123.8 +1,047.2 |
| 6 Month | 53,440.0 -1,269.0 | 44,811.5 +7,359.5 | 49,655.8 +2,515.2 |
| 1 Year | 53,440.0 -1,269.0 | 43,323.0 +8,848.0 | 48,145.9 +4,025.1 |
Dow 30 Futures : Historical Chart
Group by:
Related News


About Dow Futures 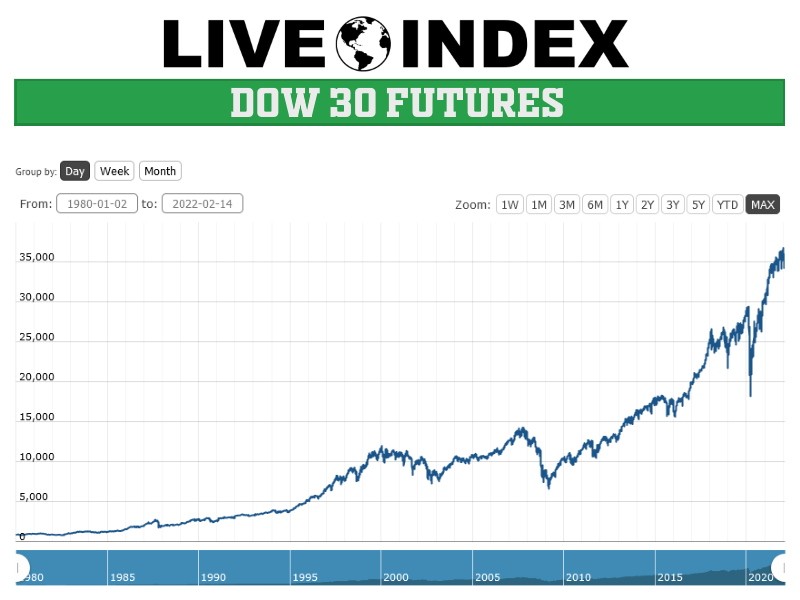
Dow Jones Futures - Dow Jones 30 Futures | Dow Jones Futures Live Quotes | US Futures
Live Price of Dow Jones Futures. Dow Jones Futures Live Chart, Intraday & Historical Chart. Dow Jones Futures Buy & Sell Signal and News & Videos, Dow Jones Futures Averages, Returns & Historical Data
» Dow Jones Futures
» Dow Jones Futures Real Time Quotes
» Dow Jones Futures Live Chart
» Dow Jones Futures Intraday Chart
» Dow Jones Futures Historical Chart
» Dow Jones Futures Buy Sell Signal
» Dow Jones Futures News
» Dow Jones Futures Videos
» Dow Jones Futures Averages
» Dow Jones Futures Returns
» Dow Jones Futures Historical Data