
| Symbol | Last | Change | % | High | Low |
|---|---|---|---|---|---|
| NIKKEI 225 – JAPAN | 66,232.2 | +2,091.1 | +3.26% | 66,232.2 | 64,203.5 |
| Close | Japan Time : Tue Jul 21 2026 21:43 | ||||
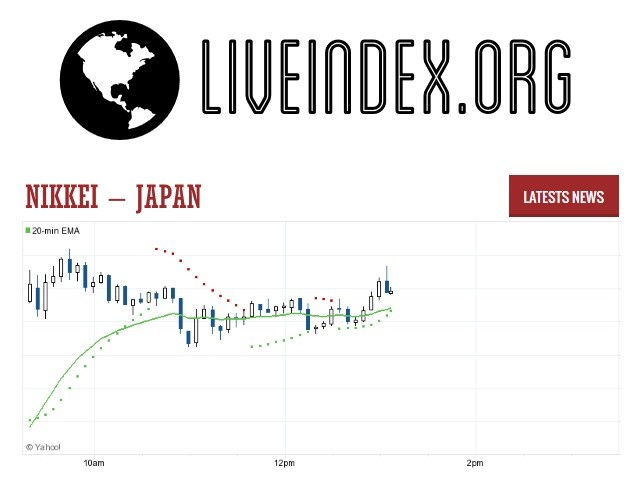
Nikkei 225 : Intraday Live Chart
Nikkei 225 : Technical Signal Buy & Sell
| 5 Min Signal | 1 Hour Signal | 1 Day Signal |
|---|---|---|
| Buy | Buy | Sell |
Nikkei 225 : Moving Averages
| Period | MA 20 | MA 50 | MA 100 |
|---|---|---|---|
| 5 Minutes | 66232.19 | 66143.55 | 66090.40 |
| 1 Hour | 64829.99 | 64383.07 | 64263.29 |
| 1 Day | 67803.39 | 68040.52 | 64280.98 |
| 1 Week | 61657.37 | 53816.67 | 46026.14 |
Nikkei 225 : Technical Resistance Level
| Resistance 1 - R1 | Resistance 2 - R2 | Resistance 3 - r3 |
|---|---|---|
| 21,380.4 | 0.0 | 21,380.4 |
Nikkei 225 : Technical Support Level
| Support 1 - S1 | Support 2 - S2 | Support 3 - S3 |
|---|---|---|
| 21,380.4 | 0.0 | 21,380.4 |
Nikkei 225 : Periodical High, Low & Average
| Period | High Change from Last | Low Change from Last | Average Change from Last |
|---|---|---|---|
| 1 Week | 68,751.5 -2,519.3 | 62,704.6 +3,527.6 | 65,699.3 +532.9 |
| 1 Month | 72,822.7 -6,590.5 | 62,704.6 +3,527.6 | 68,545.2 -2,313.0 |
| 3 Month | 72,822.7 -6,590.5 | 58,646.5 +7,585.7 | 65,262.7 +969.5 |
| 6 Month | 72,822.7 -6,590.5 | 50,575.3 +15,656.9 | 60,428.7 +5,803.5 |
| 1 Year | 72,822.7 -6,590.5 | 39,589.5 +26,642.7 | 53,480.5 +12,751.7 |
Nikkei 225 : Historical Chart
Related News


Nikkei or Nikkei 225
The Nikkei 225 is also known as Nikkei, Nikkei Stock Index or Nikkei Index. This is a stock market index for Tokyo Stock Exchange which is also known as TSE. Since 1950, this index has been calculated daily by the Nihon Keizai Shimbun. Actually, this Nihon is a Nikkei newspaper. This index is based on the price-weighted index method. All the components of this index are reviewed after every one year. The official unit of this index is Yen. Nowadays Nikkei is the most widely quoted average of whole Japanese equities. Nikkei 225 Index is quite similar to Dow Jones Industrial Average (DJIA).From 1975 to 1985 this index is also known as “Nikkei Dow Jones Industrial Average” because it is quite similar to DJIA. On 7, September 1950 this index begins to be calculated. In retroactively this index was calculated back to 16, May 1949.During the trading session, this index is updated after every 15 seconds from January 2010.In 1986, Nikkei futures and options are introduced at Singapore Exchange which is also called “SGX”, in 1988 introduced at Osaka Securities Exchange and in 1990 the futures of this index are also introduced on Chicago Mercantile Exchange which is also called CME. Nowadays this index is internationally recognized future index. The average of Nikkei can be derived from the textbook model of stock exchange sharply with growing at the speed exponential rate.
History of Nikkei 225
The Nikkei 225 began to be calculated on September 7, 1950, retroactively calculated back to May 16, 1949. Since January 2010 the index is updated every 15 seconds during trading sessions.
The Nikkei 225 Futures, introduced at Singapore Exchange (SGX) in 1986, the Osaka Securities Exchange (OSE) in 1988, Chicago Mercantile Exchange (CME) in 1990, is now an internationally recognized futures index.
On 29, December 1989 this Nikkei 225 reached its peak value 39,957 during the peak of the Japanese asset price bubble, when it reached an intra-day high of 38,957.44 before closing at 38,915.87, having grown six fold during the decade. This value is almost highest value from the creation of this index to till now. This index reached his higher value during Japanese asset price bubble. On 10, March 2009 Nikkei Index subsequently lost his nearly all gains while closing at 7054.The index drops down approximately 81%.Topix is another major index in the Tokyo stock Exchange.15, March 2011 which is the second working day after the huge earthquake in the northeast part of Japan this index dropped over 10% and reaches the value of 8605 and lost 1015 points due to this huge earthquake.
2011 was not good for Nikkei 225 index because it continued to drop throughout the whole 2011.Eventually, on 25, November the value of this index drop down to the lowest closing value which is 8160 and this lowest value is the lowest value ever in the history of this index. The closing index value of Nikkei fell over 17% in 2011.The average closing value of the whole year of 2011 is 8455. After 1982, this 2011 is the lowest ending year for this index. In the starting of 2013 Nikkei started his index with the value of 10,600 and in May, this index reached the peak value of 15,942. However after a short period of time this index plunged by almost 10% before rebounding and as a result, this makes this index most volatile stock market index among the highly developed markets. In 2015, this index reached above 20,000.The success of this index can be estimated from this fact that this index gain over 10000 in just 2 years because in 2013 the value of closing stock is about 10000 and in 2015 the value of closing stock in more than 20,000. Nikkei 225 is the fastest growing stock market index in the world.
Weightage in Nikkei
Nikkei 225 is a price-weighted average index. As this index is located in japan so its official unit is Yen. This index is similar to Dow Jones Industrial Average because it is based on a par value of 50 Yen per share. This means that if there are 50 Yens price change in any stock also affects the whole average whether the price of the stock is 5 Yens or 500 Yens. All the components of Nikkei Index are reviewed in September of every year. Any changes required in the index are published in October and the index starts working according to these changes.
For the purpose of calculating the equal weighted index, it is a must for you to find market capitalization for each stock which is used in the calculation of the index and each index is refined so that each index constituent has an equal weight in the index. On the other hand, in addition to being the product of the stock price, the stock float factor, stock shares out standings and the exchange rate is applicable when a new component or new adjustment factor is also introduced in market capitalization calculation.
Components of Nikkei 225
Following are all the components of this index with their details.
Price of Share or Stock Market Value
This component of index tells us about Price of share and stock market value of shares.
Free Float Factor
Actually, this is a method by means of which market capitalization of an index underlying companies is calculated. Anyone can find free float market capitalization by taking the equity’s prices and multiplying these prices with the number of shares available in the market.
Number of Out-standings Shares
Outstanding shares always refer to a company stock which is currently held by its all shareholders including restricted shares which are owned by company insiders of owner and block shares. These shares are shown on the balance sheet of the company under the capital stock.
Adjustment Factor
This is a type of charges which are applied on freight cost while trading between Pacific Rim countries and the United States.
Exchange Rate
At each Rebalancing date, the adjustment factor of a stock is assigned to the stock, which makes the stock value equal to each stock. For index components the value would be like this:
Adjustment Factor is Equal to Specific constant “Z” (Number of shares of the stock multiply by adjusted stock market value).The main criticism with this index is that a $5 price share would have the same weight in the index as the $200 priced to share. Due to these reason smaller shares gets more weight as compared to their price. Moreover, the stocks in this index keep changing so due to this changing stock is rebalanced from time to time as compared to a cap-weighted index.
Nikkei - Nikkei 225 Index | Nikkei 225 Live Quotes | Japan Index
Live Price of Nikkei. Nikkei Live Chart, Nikkei Intraday & Historical Live Chart. Nikkei Buy Sell Signal, Nikkei News, Nikkei Videos, Nikkei Averages, Returns & Historical Data
» Nikkei
» Nikkei Real Time Quotes
» Nikkei Live Chart
» Nikkei Intraday Chart
» Nikkei Historical Chart
» Nikkei Buy Sell Signal
» Nikkei News
» Nikkei Videos
» Nikkei Averages
» Nikkei Returns
» Nikkei Historical Data