
| Symbol | Last | Change | % | High | Low |
|---|---|---|---|---|---|
| S&P 500 VIX | 17.000 | +0.410 | +2.47% | 17.060 | 15.790 |
| Open Last Trade : 13:48 | US Time : Thu Jul 02 2026 13:48 | ||||
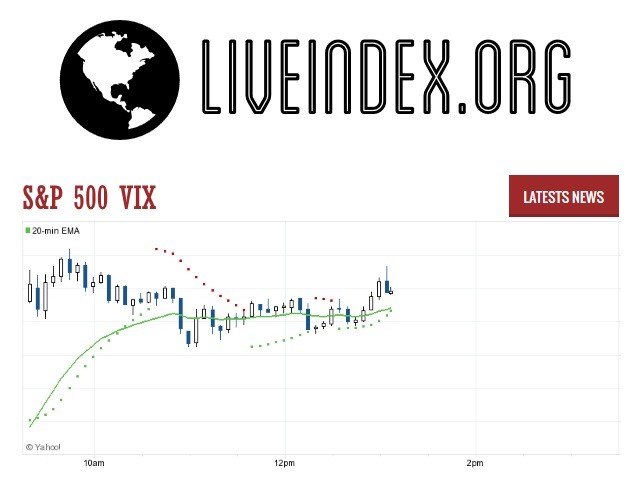
S&P 500 VIX Futures : Intraday Live Chart
S&P 500 VIX Futures : Technical Signal Buy & Sell
| 5 Min Signal | 1 Hour Signal | 1 Day Signal |
|---|---|---|
| Buy | Sell | Sell |
S&P 500 VIX Futures : Moving Averages
| Period | MA 20 | MA 50 | MA 100 |
|---|---|---|---|
| 5 Minutes | 16.76 | 16.48 | 16.50 |
| 1 Hour | 16.51 | 16.66 | 17.45 |
| 1 Day | 17.64 | 17.73 | 19.33 |
| 1 Week | 20.25 | 18.99 | 19.09 |
S&P 500 VIX Futures : Technical Resistance Level
| Resistance 1 - R1 | Resistance 2 - R2 | Resistance 3 - r3 |
|---|---|---|
| 17.617 | 18.440 | 18.947 |
S&P 500 VIX Futures : Technical Support Level
| Support 1 - S1 | Support 2 - S2 | Support 3 - S3 |
|---|---|---|
| 16.287 | 15.780 | 14.957 |
S&P 500 VIX Futures : Periodical High, Low & Average
| Period | High Change from Last | Low Change from Last | Average Change from Last |
|---|---|---|---|
| 1 Week | 20.720 -3.720 | 15.970 +1.030 | 17.830 -0.830 |
| 1 Month | 23.340 -6.340 | 15.180 +1.820 | 18.108 -1.108 |
| 3 Month | 25.230 -8.230 | 15.180 +1.820 | 18.306 -1.306 |
| 6 Month | 29.580 -12.580 | 15.180 +1.820 | 19.625 -2.625 |
| 1 Year | 29.580 -12.580 | 15.180 +1.820 | 18.906 -1.906 |
S&P 500 VIX Futures : Historical Chart
Related News


VIX is a trademarked ticker symbol for the Chicago Board Options Exchange Market Volatility Index, a popular measure of the implied volatility of S&P 500 index options. Often referred to as the fear index or the fear gauge, it represents one measure of the market’s expectation of stock market volatility over the next 30 day period.
The idea of a volatility index, and financial instruments based on such an index, was first developed and described by Prof. Menachem Brenner and Prof. Dan Galai in 1986. Professors Brenner and Galai published their research in the academic article “New Financial Instruments for Hedging Changes in Volatility,” which appeared in the July/August 1989 issue of Financial Analysts Journal.
In a subsequent paper, Professors Brenner and Galai proposed a formula to compute the volatility index.
Professors Brenner and Galai wrote “Our volatility index, to be named Sigma Index, would be updated frequently and used as the underlying asset for futures and options… A volatility index would play the same role as the market index play for options and futures on the index.”
In 1992, the CBOE retained Vanderbilt University Professor Robert Whaley to develop a tradable stock market volatility index based on index option prices. At a January 1993 news conference, Prof. Whaley provided his recommendations, and subsequently, the CBOE has computed VIX on a real-time basis. Based on the history of index option prices, Prof. Whaley computed daily VIX levels in a data series commencing January 1986, available on the CBOE website. Prof. Whaley’s research for the CBOE appeared in the Journal of Derivatives.
The VIX is quoted in percentage points and translates, roughly, to the expected movement in the S&P 500 index over the upcoming 30-day period, which is then annualized. “VIX” is a registered trademark of the CBOE.
S&P 500 VIX - VIX Index Futures | S&P 500 VIX Live Quotes | VIX Index
Live Price of S&P 500 VIX Futures. S&P 500 VIX Futures Live Chart, Intraday & Historical Chart. VIX Index Futures Buy & Sell Signal and News & Videos, S&P 500 VIX Averages, Returns & Historical Data.
» S&P 500 VIX Futures
» VIX Index Futures Real Time Quotes
» VIX Index Futures Live Chart
» S&P 500 VIX Futures Intraday Chart
» S&P 500 VIX Historical Chart
» S&P 500 VIX Futures Buy Sell Signal
» Dow Jones Futures News
» S&P 500 VIX Futures Videos
» S&P 500 VIX Averages
» S&P 500 VIX Futures Returns
» S&P 500 VIX Futures Historical Data