| Symbol | Last | Change | % | High | Low |
|---|---|---|---|---|---|
| FTSE – UK | 8,992.12 | +19.48 | +0.22% | 9,016.36 | 8,969.09 |
| Close | UK Time : Mon Jul 21 2025 05:26 | ||||
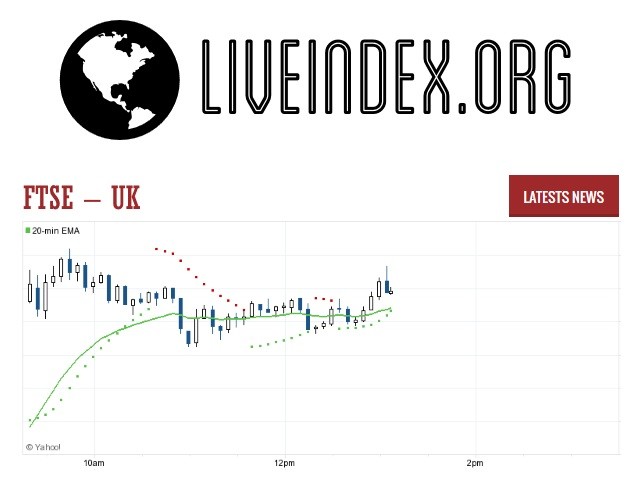
FTSE 100 : Intraday Live Chart
FTSE 100 : Technical Signal Buy & Sell
| 5 Min Signal | 1 Hour Signal | 1 Day Signal |
|---|---|---|
| Buy | Sell | Buy |
FTSE 100 : Moving Averages
| Period | MA 20 | MA 50 | MA 100 |
|---|---|---|---|
| 5 Minutes | 8989.93 | 8987.75 | 8986.92 |
| 1 Hour | 8989.30 | 8990.96 | 8976.64 |
| 1 Day | 8892.93 | 8843.27 | 8676.07 |
| 1 Week | 8634.20 | 8450.37 | 8122.20 |
FTSE 100 : Technical Resistance Level
| Resistance 1 - R1 | Resistance 2 - R2 | Resistance 3 - r3 |
|---|---|---|
| 9,002.97 | 9,019.91 | 9,050.24 |
FTSE 100 : Technical Support Level
| Support 1 - S1 | Support 2 - S2 | Support 3 - S3 |
|---|---|---|
| 8,955.70 | 8,925.37 | 8,908.43 |
FTSE 100 : Periodical High, Low & Average
| Period | High Change from Last | Low Change from Last | Average Change from Last |
|---|---|---|---|
| 1 Week | 9,016.98 -24.86 | 8,926.55 +65.57 | 8,973.13 +18.99 |
| 1 Month | 9,016.98 -24.86 | 8,707.65 +284.47 | 8,855.63 +136.49 |
| 3 Month | 9,016.98 -24.86 | 8,195.66 +796.46 | 8,732.19 +259.93 |
| 6 Month | 9,016.98 -24.86 | 7,544.83 +1,447.29 | 8,640.84 +351.28 |
| 1 Year | 9,016.98 -24.86 | 7,544.83 +1,447.29 | 8,440.80 +551.32 |
FTSE 100 : Historical Chart
FTSE or FTSE 100
FTSE stands for Financial Times Stock Exchange and often it is abbreviated as footsie. Actually, it is a share index of 100 companies which are listed on the London Stock Exchange on the basis of their Highest Market Capitalization. Some traders also called it Gauge of Businesses regulated by UK Company Law. It is one of the most widely used stock indices and is seen as a gauge of business level of UK. FTSE Group is the owner of this index and also this index is developed and maintained by this group. Nowadays FTSE group is working under London Stock Exchange. FTSE 100 companies represent about 81% of the entire market capitalization of the London Stock Exchange. Even though the FTSE All-Share Index is more comprehensive, the FTSE 100 is by far the most widely used UK stock market indicator. Other related indices are the FTSE 250 Index (which includes the next largest 250 companies after the FTSE 100), the FTSE 350 Index (which is the aggregation of the FTSE 100 and 250), FTSE Small Cap Index and FTSE Fledgling Index. The FTSE All-Share aggregates the FTSE 100, FTSE 250 and FTSE Small Cap.
History of FTSE 100
On 3, January 1984 this index started working at the base level of 1000.The highest closing value is 7122 from the creation of this index to till now. During Dot-Com bubble in 1999 this index reached to the peak which is highest for 15 years in the history of this index. This index suffers from the crisis from 2007 to 2009 and as a result in 2010 base level decline to 3500.On 8, February 2011 this index again recovered to the peak of 6091 and then on 27, April 2011 index again fall down 5000 but on 27, April 2015 index again reached its high record in his history. This index is then included in the bear market and on 11, February 2016 index closed at the value of 5537.
Overview of FTSE 100
FTSE group which is nowadays working under London Stock Exchange maintains this index. This group is a joint venture between London Stock Exchange and Financial times. All the information of this index is calculated in real time and when the market is open it is published every 15 seconds.100 largest high standing and high market value companies are included in the index of FTSE 100. Most of the companies included in the index are international companies so that’s why the movements of the index are the fairly weak indicator of the economy of UK. FTSE 250 is the better indicator of UK economy because it contains mostly UK based companies and a smaller number of International companies are included in this index. The constituents of this index can be determined quarterly such as Wednesday after the first Friday of the month. The values which are used to make changes in the indices are taken at the end of the business the night before the review of this company.
The 100 companies which are included in the list of FTSE represent about 80% of the entire market capitalization of the London Stock Exchange. FTSE 100 is so far most widely used UK stock market indicator because FTSE All-Share Index is comprehensive. FTSE 250 is another indice which is related to FTSE 100 this 250 index includes 250 most largest and high standing companies. Another FTSE indices are also available which is 350.This FTSE 350 is the combination of both FTSE 100 and 250.Those companies who wants to include in the list of FTSE must meet the number of requirements set up by the FTSE group. Time for trading on London Stock Exchange starts at 08:00 and ends at 16:30 daily. Closing values of London stock exchange were taken on 16:35 daily.
Weighting in FTSE 100
Market Capitalization is the way or method through which FTSE indices share prices are weighted. So that larger or higher standing companies which are included in the index of FTSE make more of a difference in the index as compared to the smaller companies included in the index. Sometimes trader uses the formula for the purpose of calculation which is created by FTSE Group. All the shares which are available for the trading were represented by a factor which is called “Free Float Adjustment Factor”. After all, this factor is then rounded up to the 5% of nearest multiples. If any trader wants to find Free-Float capitalization of any company then it is a must for the trader to find firstly its market cap. For finding market cap of any company just follow the simple formula “Number of Shares*Shares price”. After finding market cap multiply it by its free-float factor. Restricted stocks such as stocks held by company insiders are not included in free-float capitalization.
The constituents of the index are determined quarterly; the largest companies in the FTSE 250 Index are promoted if their market capitalisation would place them in the top ninety companies of the FTSE 100 Index.
Component companies must meet a number of requirements set out by the FTSE Group, including having a full listing on the London Stock Exchange with Sterling or Euro denominated price on the Stock Exchange Electronic Trading Service, and meeting certain tests on nationality, free float, and liquidity.
FTSE Group
FTSE Group is owned by London Stock Exchange (LSE).Nowadays this group is a provider of lots of stock market indices and many other services such as data services. It manages UK well-known stock index which is FTSE 100 and also a number of other indices. This group was created by Pearson and London Stock Exchange Group in 2002.Also, there is another branch in Japan which is called FTSE Japan, this branch is based in Tokyo and created in 2003.In 2011 London Stock Exchange had bought this group from Pearson. FTSE group maintain a well-known index which is FTSE 100 as well as this group maintain over 200,000 other indices. This index also includes 600 real-time indices. All the indices are classified into seven groups three are them are as follows. Fixed Income, Investment strategy and responsible investment
As in the previous paragraph, we have discussed that this group operates over 200,000 indices. These indices are included in this group from 80 countries of the world. This group earns about 60 percent of revenue from the annual subscription fees and remaining 40 percent by providing index-based Licenses for the products. FTSE group manage different types of clients such as active and passive fund managers, asset owner and lots of financial data vendors etc. The products of this group are used by market participants from all over the world for the purpose of performance measurement, Analysis of investment and asset allocation etc. Lots of ETFs providers and investment banks use the services of FTSE for the purpose of benchmarking their investment performance. One another service which is also offered by FTSE is that it is also offering many exchanges in all over the world with their domestic indices.
FTSE - FTSE 100 Index | FTSE 100 Live Quotes | UK Index
Live Price of FTSE. FTSE Live Chart, FTSE Intraday & Historical Live Chart. FTSE Buy Sell Signal, FTSE News, FTSE Videos, FTSE Averages, Returns & Historical Data
» FTSE
» FTSE Real Time Quotes
» FTSE Live Chart
» FTSE Intraday Chart
» FTSE Historical Chart
» FTSE Buy Sell Signal
» FTSE News
» FTSE Videos
» FTSE Averages
» FTSE Returns
» FTSE Historical Data

