
| Symbol | Last | Change | % | High | Low |
|---|---|---|---|---|---|
| USD / CAD | 1.4198 | +0.0017 | +0.12% | 0.0000 | 0.0000 |
| Close | GMT Time : Sun Jul 05 2026 18:09 | ||||
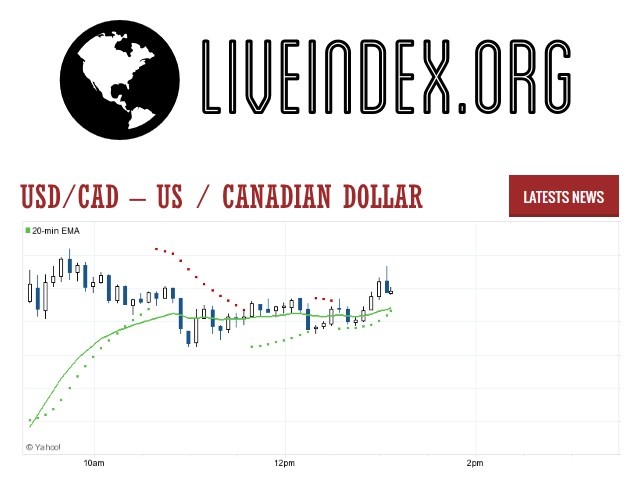
USD/CAD : Intraday Live Chart
USD/CAD : Technical Signal Buy & Sell
| 5 Min Signal | 1 Hour Signal | 1 Day Signal |
|---|---|---|
| Neutral | Buy | Buy |
USD/CAD : Moving Averages
| Period | MA 20 | MA 50 | MA 100 |
|---|---|---|---|
| 5 Minutes | 0.00 | 0.00 | 0.00 |
| 1 Hour | 1.42 | 1.42 | 1.42 |
| 1 Day | 1.42 | 1.40 | 1.39 |
| 1 Week | 1.38 | 1.38 | 1.39 |
USD/CAD : Technical Resistance Level
| Resistance 1 - R1 | Resistance 2 - R2 | Resistance 3 - r3 |
|---|---|---|
| 0.0000 | 0.0000 | 0.0000 |
USD/CAD : Technical Support Level
| Support 1 - S1 | Support 2 - S2 | Support 3 - S3 |
|---|---|---|
| 0.0000 | 0.0000 | 0.0000 |
USD/CAD : Periodical High, Low & Average
| Period | High Change from Last | Low Change from Last | Average Change from Last |
|---|---|---|---|
| 1 Week | 1.4221 -0.0023 | 0.0000 +1.4198 | 1.4201 -0.0003 |
| 1 Month | 1.4236 -0.0038 | 0.0000 +1.4198 | 1.4096 +0.0102 |
| 3 Month | 1.4236 -0.0038 | 0.0000 +1.4198 | 1.3861 +0.0337 |
| 6 Month | 1.4236 -0.0038 | 0.0000 +1.4198 | 1.3799 +0.0399 |
| 1 Year | 1.4236 -0.0038 | 0.0000 +1.4198 | 1.3829 +0.0369 |
USD/CAD : Historical Chart
Related News


USD to CAD Exchange Rate History: Tracking Decades of Loonie vs. Dollar Movements
The USD to CAD exchange rate represents the dynamic economic relationship between the United States and Canada. Known as the “Loonie” due to the loon depicted on the Canadian $1 coin, the Canadian dollar is among the top-traded currencies globally. Influenced by commodity prices, interest rate differentials, and monetary policy shifts, the USD/CAD pair plays a critical role in cross-border trade, investment decisions, and forex trading strategies.
1970s–1980s: From Peg to Float and Oil Boom Influence
Prior to 1970, the Canadian dollar was pegged to the U.S. dollar under the Bretton Woods system. However, in 1970, Canada opted for a floating exchange rate, allowing market forces to determine the USD/CAD value. This shift allowed better responsiveness to global commodity cycles and interest rate movements.
During the 1970s oil crisis, Canada benefited as a net oil exporter, supporting the loonie’s value. However, the volatile inflation environment and rising U.S. interest rates in the late 1970s and early 1980s caused fluctuations. By 1985, the Canadian dollar had depreciated significantly, and USD/CAD reached above 1.36.
1990s: Fiscal Reforms and a Strengthening Loonie
In the early 1990s, Canada faced rising debt and weak investor confidence, pushing the USD/CAD rate above 1.40. However, by mid-decade, Canada embarked on aggressive fiscal reforms, leading to budget surpluses and restored market confidence.
By the late 1990s, strong global growth and a recovering resource sector helped the Canadian dollar appreciate. USD/CAD fell from 1.44 in 1995 to around 1.38 by 1999. Despite the tech boom in the U.S., Canada’s economic stability and improving trade terms kept the loonie relatively stable.
2000s: Commodity Supercycle and Near Parity
The early 2000s saw a depreciation of the Canadian dollar, with USD/CAD reaching near 1.60 in 2002 due to a strong U.S. dollar and weak commodity prices. However, the tide turned rapidly.
From 2003 to 2007, Canada enjoyed a resource-driven boom. Rising oil prices, mining exports, and foreign investment led to a strong loonie. The USD/CAD fell below parity in 2007 for the first time since the 1970s, reaching a low of 0.93. The 2008 global financial crisis briefly reversed gains, with USD/CAD surging to 1.30 before stabilizing near parity again.
2010s: Rate Divergence and Oil Price Crashes
Throughout the 2010s, interest rate divergence between the Federal Reserve and the Bank of Canada (BoC) shaped the USD/CAD trend. Initially, low U.S. rates kept USD/CAD near 1.00 through 2012. But as the Fed began tightening in 2015 and global oil prices collapsed, the loonie weakened significantly.
In 2016, oil prices dropped below $30 per barrel, and the USD/CAD rate soared above 1.45. While the loonie regained some ground in 2017–2018 amid modest BoC hikes, the U.S. maintained a stronger rate trajectory. By 2019, the pair settled between 1.30 and 1.35.
2020–2024: Pandemic Recovery and Rate Realignment
The COVID-19 pandemic in 2020 disrupted global markets and sparked aggressive rate cuts in both the U.S. and Canada. Initially, USD/CAD surged past 1.45 in March 2020 as investors fled to USD safety.
However, Canada’s swift vaccine rollout and strong commodities rebound in 2021 helped the loonie appreciate, with USD/CAD falling to 1.20 by June 2021. As inflation spiked, both central banks began tightening. The BoC’s front-loaded rate hikes in 2022 narrowed the rate gap with the U.S., supporting the Canadian dollar.
In 2023–2024, rate volatility, mixed inflation prints, and divergent GDP trends kept the USD/CAD within a range of 1.32–1.38. As of April 2025, the pair trades around 1.36 amid global growth concerns and subdued oil momentum.
✅ Key:
🟢 = Canadian dollar appreciated vs USD
❌ = Canadian dollar depreciated vs USD
⚠️ = Minimal change / Range-bound
📊 USD to CAD Exchange Rate by Decade
| Decade | Avg. USD/CAD Rate (Approx) | Change vs. Previous Decade | Key Events |
|---|---|---|---|
| 1970s | 1.00 → 1.17 | ❌ -17% CAD depreciation | End of Bretton Woods, oil shocks, move to float |
| 1980s | 1.17 → 1.36 | ❌ -16% CAD depreciation | U.S. rate hikes, Canadian inflation |
| 1990s | 1.36 → 1.38 | ⚠️ Flat | Canadian fiscal reform, NAFTA, global growth |
| 2000s | 1.38 → 1.15 | 🟢 +17% CAD appreciation | Commodity boom, parity moment, financial crisis |
| 2010s | 1.15 → 1.30 | ❌ -13% CAD depreciation | Oil collapse, Fed-BoC rate divergence |
| 2020s (till 2025) | 1.30 → 1.36 | ⚠️ Range-bound | Pandemic, BoC-Fed policy swings, inflation uncertainty |
USD/CAD - US Dollar / Canadian Dollar Currency Rate
Live Price of USD/CAD. USD/CAD Live Chart, Intraday & Historical Live Chart, Buy Sell Signal, USD/CAD News, USD/CAD Averages, Returns & Historical Data
» USD/CAD
» USD/CAD Real Time Quotes
» USD/CAD Live Chart
» USD/CAD Intraday Chart
» USD/CAD Historical Chart
» USD/CAD Buy Sell Signal
» USD/CAD News
» USD/CAD Videos
» USD/CAD Averages
» USD/CAD Currency Pair
» USD/CAD Historical Data