
| Symbol | Last | Change | % | High | Low |
|---|---|---|---|---|---|
| USD / INR | 96.235 | -0.205 | -0.21% | 96.413 | 96.135 |
| Close | GMT Time : Tue Jul 21 2026 12:46 | ||||
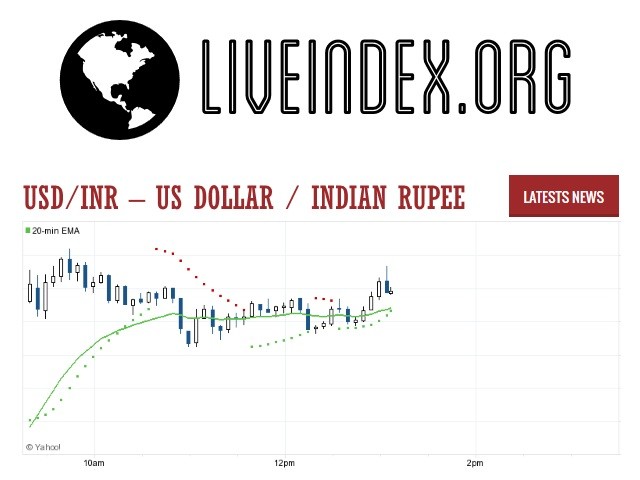
USD/INR : Intraday Live Chart
USD/INR : Technical Signal Buy & Sell
| 5 Min Signal | 1 Hour Signal | 1 Day Signal |
|---|---|---|
| Sell | Buy | Buy |
USD/INR : Moving Averages
| Period | MA 20 | MA 50 | MA 100 |
|---|---|---|---|
| 5 Minutes | 96.23 | 96.23 | 96.27 |
| 1 Hour | 96.37 | 96.35 | 96.32 |
| 1 Day | 95.61 | 95.17 | 94.87 |
| 1 Week | 94.09 | 91.05 | 87.98 |
USD/INR : Technical Resistance Level
| Resistance 1 - R1 | Resistance 2 - R2 | Resistance 3 - r3 |
|---|---|---|
| 0.000 | 0.000 | 0.000 |
USD/INR : Technical Support Level
| Support 1 - S1 | Support 2 - S2 | Support 3 - S3 |
|---|---|---|
| 0.000 | 0.000 | 0.000 |
USD/INR : Periodical High, Low & Average
| Period | High Change from Last | Low Change from Last | Average Change from Last |
|---|---|---|---|
| 1 Week | 0.000 +96.235 | 0.000 +96.235 | 96.296 -0.061 |
| 1 Month | 0.000 +96.235 | 0.000 +96.235 | 95.270 +0.965 |
| 3 Month | 95.750 +0.485 | 0.000 +96.235 | 95.163 +1.072 |
| 6 Month | 95.750 +0.485 | 0.000 +96.235 | 93.651 +2.584 |
| 1 Year | 95.750 +0.485 | 0.000 +96.235 | 91.038 +5.197 |
USD/INR : Historical Chart
Related News


USD to INR Exchange Rate History: Trends, Crises, and Currency Policy Impact
The USD to INR exchange rate serves as a vital financial indicator, reflecting not only India’s economic trajectory but also broader shifts in global trade, monetary policy, and geopolitical alignment. From being tightly regulated to now floating with market influences, the INR to USD pair has seen an extraordinary journey across the past century.
As India transitioned from colonial rule to a developing and then emerging market economy, its exchange rate regime evolved from fixed to managed to floating. These transitions were driven by economic reforms, oil shocks, global financial crises, and domestic inflation cycles. Traders, economists, and businesses keenly observe the USD/INR pair to hedge risk, manage imports/exports, and forecast capital flows.
1940s–1970s: The Bretton Woods System and Fixed Exchange Regime
Post-independence in 1947, India adopted a par value system under the Bretton Woods Agreement, fixing the rupee to the U.S. dollar at 1 USD = 4.76 INR. The Reserve Bank of India (RBI) intervened to maintain this fixed rate using its forex reserves.
During the 1966 rupee devaluation, India shifted the rate to 1 USD = 7.50 INR following a balance of payments crisis and pressure from the World Bank and IMF. This marked India’s first major devaluation, aimed at boosting exports and curbing trade deficits.
Through the 1970s, the rupee remained pegged to the dollar, moving gradually to around 8.40 INR/USD by 1979. India’s tightly controlled foreign exchange system meant minimal volatility, but also limited trade flexibility.
1980s: Controlled Depreciation and Fiscal Pressures
The 1980s were marked by rising oil import bills, external borrowing, and declining reserves. India implemented a crawling peg system, allowing periodic and mild depreciation of the INR to support competitiveness.
By the end of the decade, the USD/INR exchange rate hovered around 16–17, reflecting a slow but steady weakening. Capital controls, import licensing, and foreign exchange rationing remained dominant, keeping the FX market artificial and opaque.
1990s: Economic Liberalization and Market-Based Rates
The 1991 balance of payments crisis was a watershed moment. Facing default, India pledged gold to the Bank of England and received an IMF bailout. In return, the country liberalized its economy and adopted a dual exchange rate regime in 1992, followed by full current account convertibility in 1994.
The rupee depreciated rapidly during this phase, with the USD/INR rate moving from 17 to 32 in under four years. This dramatic change was due to lifting of trade restrictions, high inflation, and open market pricing.
By 1999, the rupee had crossed 43 against the dollar, with the RBI gradually shifting toward a managed float system — intervening only to smooth volatility, rather than fixing the rate.
2000s: Capital Flows and Rupee Resilience
The 2000s witnessed increased foreign investment inflows, a booming IT and service sector, and growing trade with the U.S. and China. Despite global uncertainties like the dot-com bust and 2008 financial crisis, India’s macroeconomic fundamentals remained strong.
The INR to USD exchange rate ranged from 45 to 50 for most of the decade, with brief appreciation episodes such as in 2007, when the rupee strengthened to 39/USD, aided by record FII inflows and remittances.
However, the global crisis of 2008 led to a sharp depreciation, with the rate sliding back to 50 INR/USD by year-end. The RBI maintained reserves at comfortable levels and used monetary tools to manage exchange rate pressure.
2010s: Taper Tantrum, Oil Shock, and Policy Shift
The 2010s began with stable economic growth but were quickly disrupted by high current account deficits, oil price volatility, and global capital flight triggered by the U.S. Fed’s taper tantrum in 2013.
The rupee fell to a then-record low of 68.85/USD in August 2013, prompting the RBI to introduce dollar swap windows and increase interest rates. Despite headwinds, the Make in India initiative, rise in services exports, and stable governance underpinned moderate recovery.
From 2014 to 2019, the USD/INR pair traded between 62 and 72, influenced by crude oil prices, geopolitical tensions, and emerging market capital flows. The RBI’s forex reserves strategy grew increasingly aggressive, keeping currency volatility in check.
2020s: Pandemic, Inflation, and Global Divergence
The COVID-19 pandemic severely disrupted global supply chains. India faced both demand shocks and supply constraints. Initially, the rupee weakened to 76/USD in 2020, then stabilized as India became a top vaccine exporter and resumed growth.
In 2022, the Russia-Ukraine conflict pushed oil prices higher, and the U.S. Fed’s aggressive rate hikes led to dollar strengthening. The rupee touched a historic low of 83.20/USD in late 2022.
As of April 2025, the USD/INR rate stands at around 83.15, with RBI managing the float via FX market interventions. India’s robust GDP growth, lower inflation, and stable policy environment have helped mitigate excessive depreciation, though external shocks still pose challenges.
USD to INR: Decade-Wise Exchange Rate Table
| Decade | Avg. Exchange Rate (Approx) | Change from Previous Decade |
|---|---|---|
| 1940s | 4.76 INR/USD (fixed) | 🟢 Stable |
| 1950s | 4.76 INR/USD | 🟢 No change |
| 1960s | 4.76 → 7.50 INR/USD | ❌ -58% depreciation |
| 1970s | 7.50 → 8.40 INR/USD | ❌ -12% depreciation |
| 1980s | 8.40 → 16.50 INR/USD | ❌ -96% depreciation |
| 1990s | 17.00 → 43.00 INR/USD | ❌ -153% depreciation |
| 2000s | 43.00 → 50.00 INR/USD | ❌ -16% depreciation |
| 2010s | 50.00 → 71.00 INR/USD | ❌ -42% depreciation |
| 2020s (till 2025) | 72.00 → 83.15 INR/USD | ❌ -15.5% depreciation |
✅ Key:
🟢 = Stable
❌ = INR depreciation vs. USD
📈 = Inflation impact + policy change
📉 = Capital outflows or crisis impact
USD/INR - US Dollar / Indian Rupee Currency Rate
Live Price of USD/INR. USD/INR Live Chart, Intraday & Historical Live Chart, Buy Sell Signal, USD/INR News, USD/INR Averages, Returns & Historical Data
» USD/INR
» USD/INR Real Time Quotes
» USD/INR Live Chart
» USD/INR Intraday Chart
» USD/INR Historical Chart
» USD/INR Buy Sell Signal
» USD/INR News
» USD/INR Videos
» USD/INR Averages
» USD/INR Currency Pair
» USD/INR Historical Data