
| Symbol | Last | Change | % | High | Low |
|---|---|---|---|---|---|
| GOLD | 4,053.10 | +37.20 | +0.93% | 4,057.20 | 4,003.30 |
| Open Last Trade : 05:07 | GMT Time : Tue Jul 21 2026 05:07 | ||||
Gold : Intraday Live Chart
Gold : Technical Signal Buy & Sell
| 5 Min Signal | 1 Hour Signal | 1 Day Signal |
|---|---|---|
| Buy | Sell | Sell |
Gold : Moving Averages
| Period | MA 20 | MA 50 | MA 100 |
|---|---|---|---|
| 5 Minutes | 4049.17 | 4039.30 | 4025.57 |
| 1 Hour | 4020.84 | 4020.95 | 4016.66 |
| 1 Day | 4084.91 | 4185.94 | 4425.78 |
| 1 Week | 4563.41 | 4290.61 | 3609.25 |
Gold : Technical Resistance Level
| Resistance 1 - R1 | Resistance 2 - R2 | Resistance 3 - r3 |
|---|---|---|
| 4,017.63 | 4,024.80 | 4,029.03 |
Gold : Technical Support Level
| Support 1 - S1 | Support 2 - S2 | Support 3 - S3 |
|---|---|---|
| 4,006.23 | 4,002.00 | 3,994.83 |
Gold : Periodical High, Low & Average
| Period | High Change from Last | Low Change from Last | Average Change from Last |
|---|---|---|---|
| 1 Week | 4,071.90 -18.80 | 3,963.00 +90.10 | 4,022.53 +30.57 |
| 1 Month | 4,231.40 -178.30 | 3,963.00 +90.10 | 4,087.69 -34.59 |
| 3 Month | 4,771.00 -717.90 | 3,963.00 +90.10 | 4,370.92 -317.82 |
| 6 Month | 5,584.30 -1,531.20 | 3,963.00 +90.10 | 4,643.05 -589.95 |
| 1 Year | 5,584.30 -1,531.20 | 3,303.00 +750.10 | 4,290.96 -237.86 |
Gold : Historical Chart
Group by:
Related News


About Gold 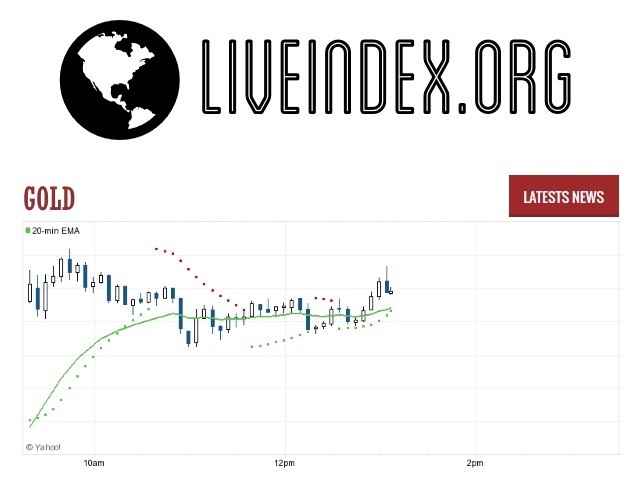
Gold | Gold Prices | Gold Live Quotes | Gold Prices in US Dollar | Gold Live Quotes
Live Price of Gold. Gold Live Chart, Intraday & Historical Chart. Gold Buy & Sell Signal and News & Videos, Gold Averages, Returns & Historical Data
» Gold
» Gold Real Time Quotes
» Gold Live Chart
» Gold Intraday Chart
» Gold Historical Chart
» Gold Buy Sell Signal
» Gold News
» Gold Videos
» Gold Averages
» Gold Currency Pair
» Gold Historical Data