
| Symbol | Last | Change | % | High | Low |
|---|---|---|---|---|---|
| ATHEX – GREECE | 2,566.01 | -5.89 | -0.23% | 2,588.41 | 2,563.87 |
| Open Last Trade : 15:45 | Greece Time : Fri Jul 31 2026 15:45 | ||||
Athex : Intraday Live Chart
Athex : Technical Signal Buy & Sell
| 5 Min Signal | 1 Hour Signal | 1 Day Signal |
|---|---|---|
| Buy | Buy | Buy |
Athex : Moving Averages
| Period | MA 20 | MA 50 | MA 100 |
|---|---|---|---|
| 5 Minutes | 2572.54 | 2572.34 | 2572.34 |
| 1 Hour | 2564.10 | 2552.13 | 2536.03 |
| 1 Day | 2495.51 | 2482.64 | 2381.74 |
| 1 Week | 2320.97 | 2207.09 | 1911.34 |
Athex : Technical Resistance Level
| Resistance 1 - R1 | Resistance 2 - R2 | Resistance 3 - r3 |
|---|---|---|
| 2,561.70 | 2,584.55 | 2,617.63 |
Athex : Technical Support Level
| Support 1 - S1 | Support 2 - S2 | Support 3 - S3 |
|---|---|---|
| 2,505.77 | 2,472.69 | 2,449.84 |
Athex : Periodical High, Low & Average
| Period | High Change from Last | Low Change from Last | Average Change from Last |
|---|---|---|---|
| 1 Week | 2,571.93 -5.92 | 2,472.07 +93.94 | 2,518.44 +47.57 |
| 1 Month | 2,571.93 -5.92 | 2,427.76 +138.25 | 2,501.48 +64.53 |
| 3 Month | 2,571.93 -5.92 | 2,187.36 +378.65 | 2,398.55 +167.46 |
| 6 Month | 2,571.93 -5.92 | 1,998.09 +567.92 | 2,311.15 +254.86 |
| 1 Year | 2,571.93 -5.92 | 1,948.51 +617.50 | 2,195.76 +370.25 |
Athex : Historical Chart
Group by:
Related News


About Athex – Greece 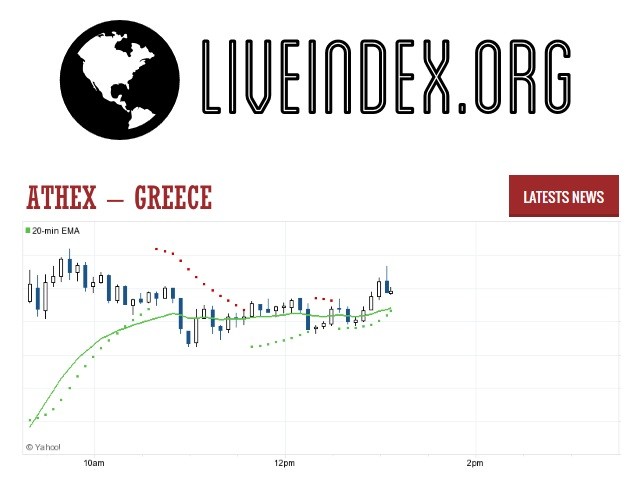
The FTSE/Athex Large Cap is the index of the twenty-five largest companies on the Athens Stock Exchange. It was renamed from FTSE/Athex 20 and extended from 20 to 25 companies on December 3, 2012.
Athex - Athex 25 Index | Athex 25 Live Quotes | Greece Index
Live Price of Athex. Athex Live Chart, Athex Intraday & Historical Live Chart. Athex Buy Sell Signal, Athex News, Athex Videos, Athex Averages, Returns & Historical Data
» Athex
» Athex Real Time Quotes
» Athex Live Chart
» Athex Intraday Chart
» Athex Historical Chart
» Athex Buy Sell Signal
» Athex News
» Athex Videos
» Athex Averages
» Athex Returns
» Athex Historical Data