
| Symbol | Last | Change | % | High | Low |
|---|---|---|---|---|---|
| EUR / JPY | 186.31 | +0.18 | +0.10% | 186.34 | 186.05 |
| Open Last Trade : 02:56 | GMT Time : Thu Jul 23 2026 02:56 | ||||
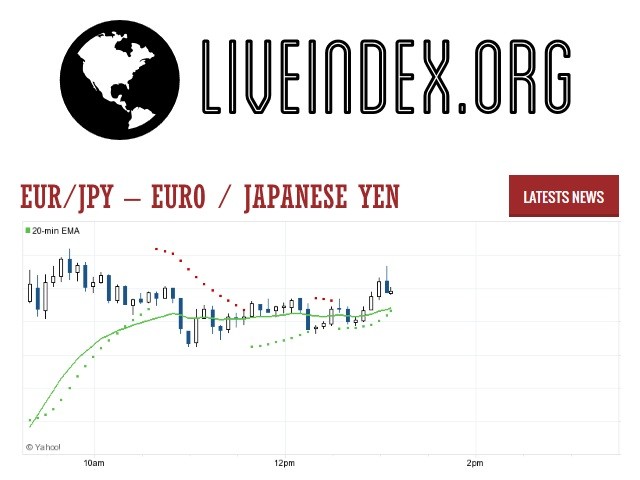
EUR/JPY : Intraday Live Chart
EUR/JPY : Technical Signal Buy & Sell
| 5 Min Signal | 1 Hour Signal | 1 Day Signal |
|---|---|---|
| Buy | Buy | Buy |
EUR/JPY : Moving Averages
| Period | MA 20 | MA 50 | MA 100 |
|---|---|---|---|
| 5 Minutes | 186.19 | 186.13 | 186.11 |
| 1 Hour | 186.05 | 185.90 | 185.78 |
| 1 Day | 185.25 | 185.06 | 185.30 |
| 1 Week | 184.91 | 180.90 | 172.67 |
EUR/JPY : Technical Resistance Level
| Resistance 1 - R1 | Resistance 2 - R2 | Resistance 3 - r3 |
|---|---|---|
| 186.16 | 186.21 | 186.24 |
EUR/JPY : Technical Support Level
| Support 1 - S1 | Support 2 - S2 | Support 3 - S3 |
|---|---|---|
| 186.08 | 186.05 | 186.00 |
EUR/JPY : Periodical High, Low & Average
| Period | High Change from Last | Low Change from Last | Average Change from Last |
|---|---|---|---|
| 1 Week | 186.13 +0.18 | 0.00 +186.31 | 185.81 +0.50 |
| 1 Month | 186.13 +0.18 | 0.00 +186.31 | 184.97 +1.34 |
| 3 Month | 187.29 -0.98 | 0.00 +186.31 | 185.05 +1.26 |
| 6 Month | 187.62 -1.31 | 0.00 +186.31 | 184.63 +1.68 |
| 1 Year | 187.62 -1.31 | 0.00 +186.31 | 180.83 +5.48 |
EUR/JPY : Historical Chart
Related News


EUR to JPY Exchange Rate History: A Tale of Negative Rates, Safe-Haven Demand, and Divergent Policies
The EUR to JPY exchange rate reflects a multi-decade interplay between two of the world’s most heavily traded currencies. Japan’s reputation as a deflationary, export-driven, low-yield economy has often contrasted sharply with the Eurozone’s shifting monetary regimes, sovereign debt challenges, and monetary experiments. As a result, the EUR/JPY pair has been shaped by policy divergence, global risk sentiment, and interest rate differentials.
1999–2002: Euro’s Volatile Birth, Yen’s Strength
The euro launched in 1999, debuting at around EUR/JPY 130. However, early skepticism about the euro’s future, combined with Japan’s strong export performance and large current account surplus, drove the pair down to 88 by 2000.
The yen benefited from its safe-haven appeal during global uncertainty, while the euro struggled with credibility issues. This era was marked by sharp EUR depreciation and JPY strength.
2003–2008: Euro Surge Meets Deflationary Japan
From 2003 onwards, the euro entered a strong bull market, benefiting from rising interest rates and a weakening U.S. dollar. Meanwhile, Japan remained trapped in deflation, with near-zero interest rates and a sluggish recovery.
EUR/JPY surged from 110 to peak at 170 in mid-2008, as carry trades flourished, with investors borrowing in yen to invest in higher-yielding euro assets. This marked the euro’s strongest performance against the yen in history.
2009–2012: Global Crisis and Eurozone Turmoil
The 2008 global financial crisis reversed the trend. As global markets sold off, investors unwound carry trades, triggering a yen rally. The EUR/JPY rate fell sharply from 170 to 115 by 2010.
The Eurozone debt crisis from 2010 to 2012 further weakened the euro, while Japan’s yen appreciated, reaching a record EUR/JPY 95 by mid-2012. Despite Japan’s stagnation, the yen was buoyed by its safe-haven status and trade surpluses.
2013–2019: Abenomics, Quantitative Easing, and Yen Weakness
With the introduction of Abenomics in 2013, Japan launched massive monetary easing and fiscal stimulus, while the ECB adopted a more cautious stance until 2015. As the Bank of Japan (BoJ) expanded QE and cut rates into negative territory, the yen depreciated substantially.
EUR/JPY rebounded from 95 to 135 by 2015, before stabilizing in a range of 115–130 through 2019. Diverging monetary policy became the central driver of the exchange rate during this phase.
2020–2024: Pandemic, Policy Divergence, and Yen Crisis
The COVID-19 pandemic disrupted all major currencies, but Japan’s prolonged ultra-loose monetary stance clashed with the ECB’s tightening cycle from 2022 onwards. As the ECB hiked aggressively to combat inflation, the BoJ maintained yield curve control and negative rates, leading to a historic yen depreciation.
EUR/JPY soared from 120 in 2020 to over 165 in 2023, the highest since the 2008 peak. The yen lost safe-haven appeal as Japan’s real rates plummeted and FX interventions failed to stem the slide.
As of April 2025, the EUR/JPY rate stands around 161.50, slightly off recent highs. The BoJ has started normalizing policy cautiously, but the yen remains fundamentally weaker due to long-term structural constraints, such as demographics, fiscal deficits, and low productivity growth.
✅ Key:
🟢 = JPY appreciated vs euro
❌ = JPY depreciated vs euro
⚠️ = Mixed or range-bound trend
📊 EUR to JPY Exchange Rate by Decade
| Decade | Avg. EUR/JPY Rate (Approx) | Change vs. Previous Decade | Key Events |
|---|---|---|---|
| 1999–2002 | 130 → 88 | 🟢 -32% JPY appreciation | Euro volatility, yen safe-haven flows |
| 2003–2008 | 88 → 170 | ❌ +93% JPY depreciation | Carry trade boom, euro strength |
| 2009–2012 | 170 → 95 | 🟢 -44% JPY appreciation | GFC, euro debt crisis, carry trade unwind |
| 2013–2019 | 95 → 130 | ❌ +37% JPY depreciation | Abenomics, QE divergence |
| 2020–2024 | 130 → 161.50 | ❌ +24% JPY depreciation | Pandemic, ECB tightening, yen crisis |
The EUR to JPY exchange rate remains one of the most interest rate-sensitive and policy-driven currency pairs. Going forward, the market will be watching the BoJ’s policy normalization path and the ECB’s inflation battle. While the yen may regain strength if Japanese rates rise, its structural headwinds suggest continued long-term weakness unless dramatic reforms emerge.
EUR/JPY - Euro / Japanese Yen Currency Rate
Live Price of EUR/JPY. EUR/JPY Live Chart, Intraday & Historical Live Chart, Buy Sell Signal, EUR/JPY News, EUR/JPY Averages, Returns & Historical Data
» EUR/JPY
» EUR/JPY Real Time Quotes
» EUR/JPY Live Chart
» EUR/JPY Intraday Chart
» EUR/JPY Historical Chart
» EUR/JPY Buy Sell Signal
» EUR/JPY News
» EUR/JPY Videos
» EUR/JPY Averages
» EUR/JPY Currency Pair
» EUR/JPY Historical Data