
| Symbol | Last | Change | % | High | Low |
|---|---|---|---|---|---|
| ALL ORDINARIES – AUSTRALIA | 8,941.50 | -76.60 | -0.85% | 9,018.10 | 8,909.80 |
| Close | Australia Time : Sun Jul 26 2026 03:04 | ||||
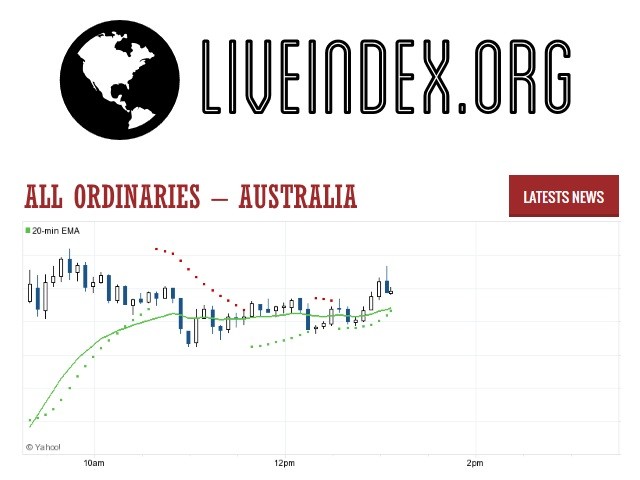
All Ordinaries : Intraday Live Chart
All Ordinaries : Technical Signal Buy & Sell
| 5 Min Signal | 1 Hour Signal | 1 Day Signal |
|---|---|---|
| Neutral | Sell | Buy |
All Ordinaries : Moving Averages
| Period | MA 20 | MA 50 | MA 100 |
|---|---|---|---|
| 5 Minutes | 8941.50 | 8941.50 | 8941.50 |
| 1 Hour | 8943.39 | 8977.44 | 8984.28 |
| 1 Day | 9000.87 | 8988.42 | 8982.06 |
| 1 Week | 8987.79 | 9055.37 | 8773.38 |
All Ordinaries : Technical Resistance Level
| Resistance 1 - R1 | Resistance 2 - R2 | Resistance 3 - r3 |
|---|---|---|
| 9,054.20 | 9,126.40 | 9,162.50 |
All Ordinaries : Technical Support Level
| Support 1 - S1 | Support 2 - S2 | Support 3 - S3 |
|---|---|---|
| 8,945.90 | 8,909.80 | 8,837.60 |
All Ordinaries : Periodical High, Low & Average
| Period | High Change from Last | Low Change from Last | Average Change from Last |
|---|---|---|---|
| 1 Week | 9,069.60 -128.10 | 8,909.80 +31.70 | 8,981.96 -40.46 |
| 1 Month | 9,069.60 -128.10 | 8,899.80 +41.70 | 8,992.87 -51.37 |
| 3 Month | 9,201.40 -259.90 | 8,717.00 +224.50 | 8,959.51 -18.01 |
| 6 Month | 9,436.20 -494.70 | 8,552.60 +388.90 | 9,012.00 -70.50 |
| 1 Year | 9,436.20 -494.70 | 8,552.60 +388.90 | 9,050.75 -109.25 |
All Ordinaries : Historical Chart
Related News


The All Ordinaries, the “All Ords”; also known as the All Ordinaries Index or AOI is the oldest index of shares in Australia, so called because it contains nearly all ordinary (or common) shares listed on the Australian Securities Exchange (ASX). The market capitalization of the companies included in the All Ords index amounts to over 95% of the value of all shares listed on the ASX. The 3-letter exchange ticker in Australia for the All Ordinaries is “XAO”.
When established, the All Ords had a base index of 500; this means that if the index is currently at 5000 points, the value of stocks in the All Ords has increased tenfold since January 1980, not factoring in inflation.
On 3 April 2000, the All Ords was restructured to consist of the 500 largest companies by market capitalisation. This coincided with the introduction of new benchmark indices such as the S&P/ASX 200. The importance of the All Ords has been significantly lessened by the introduction of these new indices.
- On 1 November 2007, the index was at 6873.20, its highest value.
- As of 22 January 2008, it had fallen to 5,222.0 points due to turmoil related to the US 2007 subprime mortgage financial crisis, a 24 percent fall.
- On 6 March 2009, it was at a low of 3,111.7 points, in the wake of a worldwide drop in stock values, 54% less than the 1 November 2007 high.
- As of 14 September 2009, the index has rebounded to 4,568.5 points, representing a 46.8 percent increase from the 6 March 2009 low.
- On 5 August 2011, the index fell to 4159 points, with a 4.6% fall in one day, the biggest fall since the subprime mortgage crisis.
- On 13 February 2013, the index rose by 28.4 (0.59%) to 5,010.30, passing 5000 for the first time since the 2008 financial crisis.
All Ordinaries - All Ords Index | All Ordinaries Live Quotes | Australia Index
Live Price of All Ordinaries. All Ordinaries Live Chart, All Ordinaries Intraday & Historical Live Chart. All Ordinaries Buy Sell Signal, All Ordinaries News, All Ordinaries Videos, All Ordinaries Averages, Returns & Historical Data
» All Ordinaries
» All Ordinaries Real Time Quotes
» All Ordinaries Live Chart
» All Ordinaries Intraday Chart
» All Ordinaries Historical Chart
» All Ordinaries Buy Sell Signal
» All Ordinaries News
» All Ordinaries Videos
» All Ordinaries Averages
» All Ordinaries Returns
» All Ordinaries Historical Data