
| Symbol | Last | Change | % | High | Low |
|---|---|---|---|---|---|
| CLX IPSA – CHILE | 11,009.2 | +55.2 | +0.50% | 11,018.6 | 10,912.9 |
| Close | Chile Time : Thu Jul 23 2026 03:25 | ||||
CLX IPSA : Intraday Live Chart
CLX IPSA : Technical Signal Buy & Sell
| 5 Min Signal | 1 Hour Signal | 1 Day Signal |
|---|---|---|
| Buy | Sell |
CLX IPSA : Moving Averages
| Period | MA 20 | MA 50 | MA 100 |
|---|---|---|---|
| 5 Minutes | |||
| 1 Hour | 7328.29 | 4093.62 | 2390.79 |
| 1 Day | 7835.14 | 9509.21 | 10185.81 |
| 1 Week | 10755.94 | 10176.19 | 8721.36 |
CLX IPSA : Technical Resistance Level
| Resistance 1 - R1 | Resistance 2 - R2 | Resistance 3 - r3 |
|---|---|---|
| 11,010.8 | 11,059.7 | 11,116.5 |
CLX IPSA : Technical Support Level
| Support 1 - S1 | Support 2 - S2 | Support 3 - S3 |
|---|---|---|
| 10,905.1 | 10,848.3 | 10,799.4 |
CLX IPSA : Periodical High, Low & Average
| Period | High Change from Last | Low Change from Last | Average Change from Last |
|---|---|---|---|
| 1 Week | 11,039.1 -29.9 | 0.0 +11,009.2 | 4,692.0 +6,317.2 |
| 1 Month | 11,062.8 -53.6 | 0.0 +11,009.2 | 8,713.1 +2,296.1 |
| 3 Month | 11,197.1 -187.9 | 0.0 +11,009.2 | 10,028.6 +980.6 |
| 6 Month | 11,721.4 -712.2 | 0.0 +11,009.2 | 10,463.3 +545.9 |
| 1 Year | 11,721.4 -712.2 | 0.0 +11,009.2 | 9,960.4 +1,048.8 |
CLX IPSA : Historical Chart
Group by:
Related News


About CLX IPSA – Chile 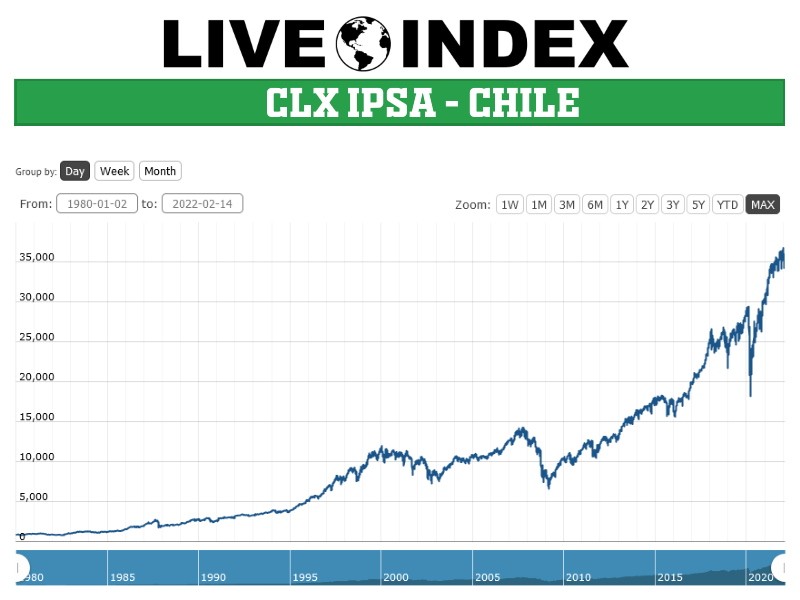
CLX IPSA - CLX IPSA Index | CLX IPSA Live Quotes | Chile Index
Live Price of CLX IPSA. CLX IPSA Live Chart, CLX IPSA Intraday & Historical Live Chart. CLX IPSA Buy Sell Signal, CLX IPSA News, CLX IPSA Videos, CLX IPSA Averages, Returns & Historical Data
» CLX IPSA
» CLX IPSA Real Time Quotes
» CLX IPSA Live Chart
» CLX IPSA Intraday Chart
» CLX IPSA Historical Chart
» CLX IPSA Buy Sell Signal
» CLX IPSA News
» CLX IPSA Videos
» CLX IPSA Averages
» CLX IPSA Returns
» CLX IPSA Historical Data