
| Symbol | Last | Change | % | High | Low |
|---|---|---|---|---|---|
| IBVC BURSATIL – VENEZUELA | 5,169.53 | +73.43 | +1.44% | 5,213.32 | 5,096.10 |
| Close | Venezuela Time : Thu Jul 23 2026 21:11 | ||||
IBVC Bursatil : Intraday Live Chart
IBVC Bursatil : Technical Signal Buy & Sell
| 5 Min Signal | 1 Hour Signal | 1 Day Signal |
|---|---|---|
| Neutral | Buy | Sell |
IBVC Bursatil : Moving Averages
| Period | MA 20 | MA 50 | MA 100 |
|---|---|---|---|
| 5 Minutes | 5169.53 | 5169.53 | 5169.53 |
| 1 Hour | 5131.77 | 5121.47 | 5132.01 |
| 1 Day | 5291.51 | 5468.41 | 5583.26 |
| 1 Week | 5796.14 | 21348.94 | 96873.00 |
IBVC Bursatil : Technical Resistance Level
| Resistance 1 - R1 | Resistance 2 - R2 | Resistance 3 - r3 |
|---|---|---|
| 5,252.31 | 5,347.82 | 5,504.03 |
IBVC Bursatil : Technical Support Level
| Support 1 - S1 | Support 2 - S2 | Support 3 - S3 |
|---|---|---|
| 5,000.59 | 4,844.38 | 4,748.87 |
IBVC Bursatil : Periodical High, Low & Average
| Period | High Change from Last | Low Change from Last | Average Change from Last |
|---|---|---|---|
| 1 Week | 5,403.61 -234.08 | 4,984.53 +185.00 | 5,138.36 +31.17 |
| 1 Month | 5,802.02 -632.49 | 4,984.53 +185.00 | 5,411.65 -242.12 |
| 3 Month | 6,199.88 -1,030.35 | 4,984.53 +185.00 | 5,566.37 -396.84 |
| 6 Month | 7,111.14 -1,941.61 | 3,259.87 +1,909.66 | 5,615.91 -446.38 |
| 1 Year | 534,358.00 -529,188.47 | 523.60 +4,645.93 | 10,770.98 -5,601.45 |
IBVC Bursatil : Historical Chart
Group by:
Related News


About IBVC Bursatil – Venezuela 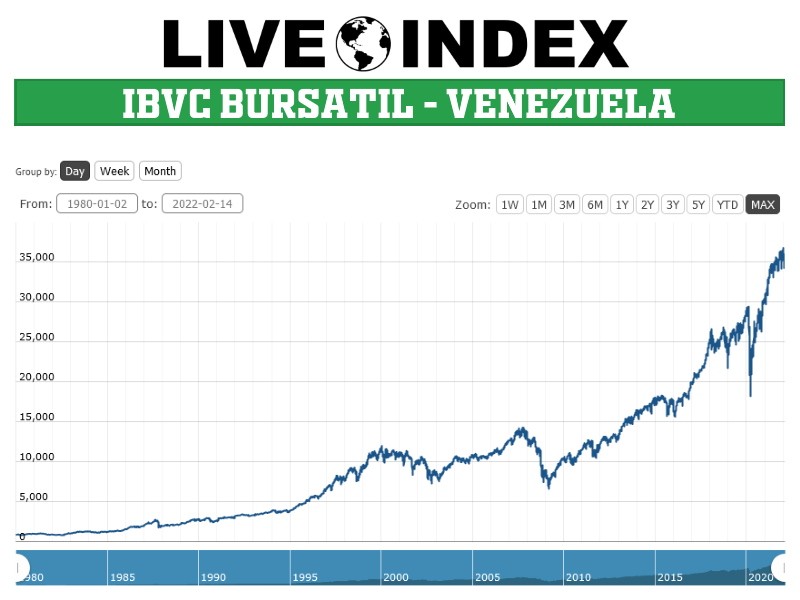
IBVC Bursatil - IBVC Bursatil Index | IBVC Bursatil Live Quotes | Venezuela Index
Live Price of IBVC Bursatil. IBVC Bursatil Live Chart, IBVC Bursatil Intraday & Historical Live Chart. IBVC Bursatil Buy Sell Signal, IBVC Bursatil News, IBVC Bursatil Videos, IBVC Bursatil Averages, Returns & Historical Data
» IBVC Bursatil
» IBVC Bursatil Real Time Quotes
» IBVC Bursatil Live Chart
» IBVC Bursatil Intraday Chart
» IBVC Bursatil Historical Chart
» IBVC Bursatil Buy Sell Signal
» IBVC Bursatil News
» IBVC Bursatil Videos
» IBVC Bursatil Averages
» IBVC Bursatil Returns
» IBVC Bursatil Historical Data