
| Symbol | Last | Change | % | High | Low |
|---|---|---|---|---|---|
| COLCAP – COLOMBIA | 2,297.00 | -4.34 | -0.19% | 2,318.64 | 2,297.00 |
| Close | Colombia Time : Wed Jul 22 2026 22:01 | ||||
Colcap : Intraday Live Chart
Colcap : Technical Signal Buy & Sell
| 5 Min Signal | 1 Hour Signal | 1 Day Signal |
|---|---|---|
| Sell | Buy | Sell |
Colcap : Moving Averages
| Period | MA 20 | MA 50 | MA 100 |
|---|---|---|---|
| 5 Minutes | 2306.54 | 2307.38 | 2307.38 |
| 1 Hour | 2301.80 | 2301.80 | 2300.09 |
| 1 Day | 2296.01 | 2308.57 | 2251.33 |
| 1 Week | 1941.66 | 1648.22 | 1496.05 |
Colcap : Technical Resistance Level
| Resistance 1 - R1 | Resistance 2 - R2 | Resistance 3 - r3 |
|---|---|---|
| 2,314.32 | 2,322.98 | 2,335.96 |
Colcap : Technical Support Level
| Support 1 - S1 | Support 2 - S2 | Support 3 - S3 |
|---|---|---|
| 2,292.68 | 2,279.70 | 2,271.04 |
Colcap : Periodical High, Low & Average
| Period | High Change from Last | Low Change from Last | Average Change from Last |
|---|---|---|---|
| 1 Week | 2,320.29 -23.29 | 2,245.65 +51.35 | 2,298.62 -1.62 |
| 1 Month | 2,395.00 -98.00 | 2,245.65 +51.35 | 2,293.44 +3.56 |
| 3 Month | 2,537.97 -240.97 | 2,072.93 +224.07 | 2,242.09 +54.91 |
| 6 Month | 2,537.97 -240.97 | 2,072.93 +224.07 | 2,251.91 +45.09 |
| 1 Year | 2,537.97 -240.97 | 2,072.93 +224.07 | 2,251.91 +45.09 |
Colcap : Historical Chart
Group by:
Related News


About Colcap – Colombia 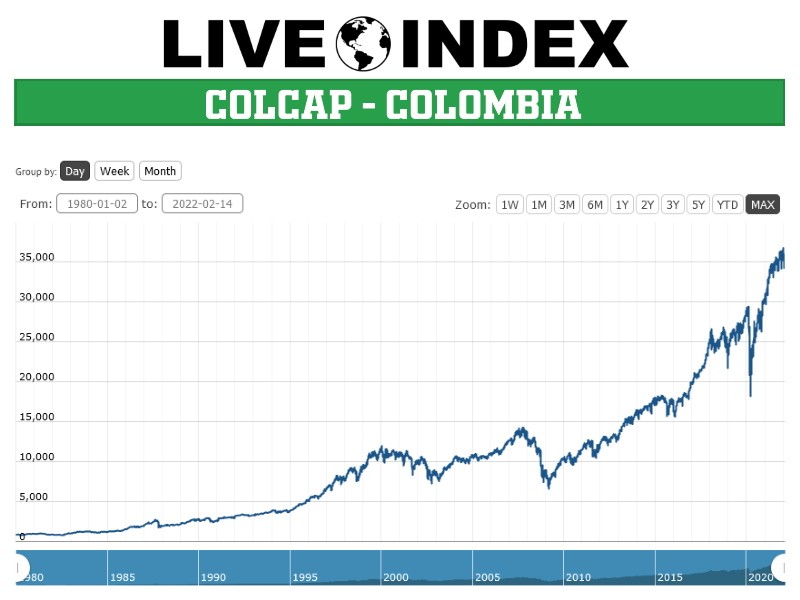
Colcap - Colcap Index | Colcap Live Quotes | Colombia Index
Live Price of Colcap. Colcap Live Chart, Colcap Intraday & Historical Live Chart. Colcap Buy Sell Signal, Colcap News, Colcap Videos, Colcap Averages, Returns & Historical Data
» Colcap
» Colcap Real Time Quotes
» Colcap Live Chart
» Colcap Intraday Chart
» Colcap Historical Chart
» Colcap Buy Sell Signal
» Colcap News
» Colcap Videos
» Colcap Averages
» Colcap Returns
» Colcap Historical Data