
| Symbol | Last | Change | % | High | Low |
|---|---|---|---|---|---|
| PLATINUM | 1,637.40 | -15.90 | -0.96% | 1,668.60 | 1,627.00 |
| Open Last Trade : 08:07 | GMT Time : Thu Jul 23 2026 08:08 | ||||
Platinum : Intraday Live Chart
Platinum : Technical Signal Buy & Sell
| 5 Min Signal | 1 Hour Signal | 1 Day Signal |
|---|---|---|
| Sell | Buy | Buy |
Platinum : Moving Averages
| Period | MA 20 | MA 50 | MA 100 |
|---|---|---|---|
| 5 Minutes | 1567.33 | 1623.26 | 1639.52 |
| 1 Hour | 1654.60 | 1648.49 | 1627.05 |
| 1 Day | 1630.87 | 1612.65 | 1816.77 |
| 1 Week | 1909.57 | 1812.94 | 1424.83 |
Platinum : Technical Resistance Level
| Resistance 1 - R1 | Resistance 2 - R2 | Resistance 3 - r3 |
|---|---|---|
| 1,649.93 | 1,661.40 | 1,668.03 |
Platinum : Technical Support Level
| Support 1 - S1 | Support 2 - S2 | Support 3 - S3 |
|---|---|---|
| 1,631.83 | 1,625.20 | 1,613.73 |
Platinum : Periodical High, Low & Average
| Period | High Change from Last | Low Change from Last | Average Change from Last |
|---|---|---|---|
| 1 Week | 1,645.10 -7.70 | 1,565.60 +71.80 | 1,615.76 +21.64 |
| 1 Month | 1,698.00 -60.60 | 0.00 +1,637.40 | 1,515.66 +121.74 |
| 3 Month | 2,173.00 -535.60 | 0.00 +1,637.40 | 1,776.91 -139.51 |
| 6 Month | 2,795.50 -1,158.10 | 0.00 +1,637.40 | 1,951.36 -313.96 |
| 1 Year | 2,795.50 -1,158.10 | 0.00 +1,637.40 | 1,804.50 -167.10 |
Platinum : Historical Chart
Group by:
Related News


About Platinum 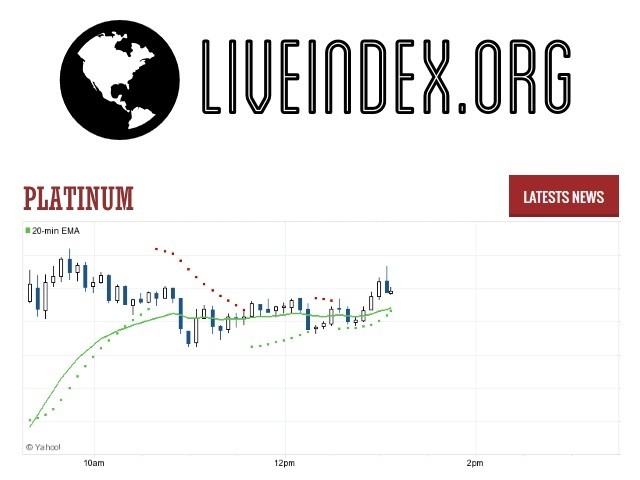
Platinum | Platinum Prices | Platinum Live Quotes | Platinum Prices in US Dollar | Platinum Live Quotes
Live Price of Platinum. Platinum Live Chart, Intraday & Historical Chart. Platinum Buy & Sell Signal and News & Videos, Platinum Averages, Returns & Historical Data
» Platinum
» Platinum Real Time Quotes
» Platinum Live Chart
» Platinum Intraday Chart
» Platinum Historical Chart
» Platinum Buy Sell Signal
» Platinum News
» Platinum Videos
» Platinum Averages
» Platinum Currency Pair
» Platinum Historical Data