
| Symbol | Last | Change | % | High | Low |
|---|---|---|---|---|---|
| BOVESPA – BRAZIL | 174,597 | -1,968 | -1.11% | 176,564 | 174,519 |
| Close | Brazil Time : Wed Jul 29 2026 14:29 | ||||
Bovespa : Intraday Live Chart
Bovespa : Technical Signal Buy & Sell
| 5 Min Signal | 1 Hour Signal | 1 Day Signal |
|---|---|---|
| Neutral | Buy | Buy |
Bovespa : Moving Averages
| Period | MA 20 | MA 50 | MA 100 |
|---|---|---|---|
| 5 Minutes | 0.00 | 0.00 | 0.00 |
| 1 Hour | 176355.95 | 175864.23 | 175014.79 |
| 1 Day | 175016.50 | 172735.98 | 177416.62 |
| 1 Week | 179601.98 | 166111.95 | 148554.28 |
Bovespa : Technical Resistance Level
| Resistance 1 - R1 | Resistance 2 - R2 | Resistance 3 - r3 |
|---|---|---|
| 177,468 | 178,539 | 180,681 |
Bovespa : Technical Support Level
| Support 1 - S1 | Support 2 - S2 | Support 3 - S3 |
|---|---|---|
| 174,255 | 172,113 | 171,042 |
Bovespa : Periodical High, Low & Average
| Period | High Change from Last | Low Change from Last | Average Change from Last |
|---|---|---|---|
| 1 Week | 178,539 -3,942 | 173,328 +1,269 | 175,471 -874 |
| 1 Month | 178,539 -3,942 | 169,666 +4,931 | 174,391 +206 |
| 3 Month | 188,710 -14,113 | 167,658 +6,939 | 175,244 -647 |
| 6 Month | 199,355 -24,758 | 167,658 +6,939 | 181,025 -6,428 |
| 1 Year | 199,355 -24,758 | 131,883 +42,714 | 165,435 +9,162 |
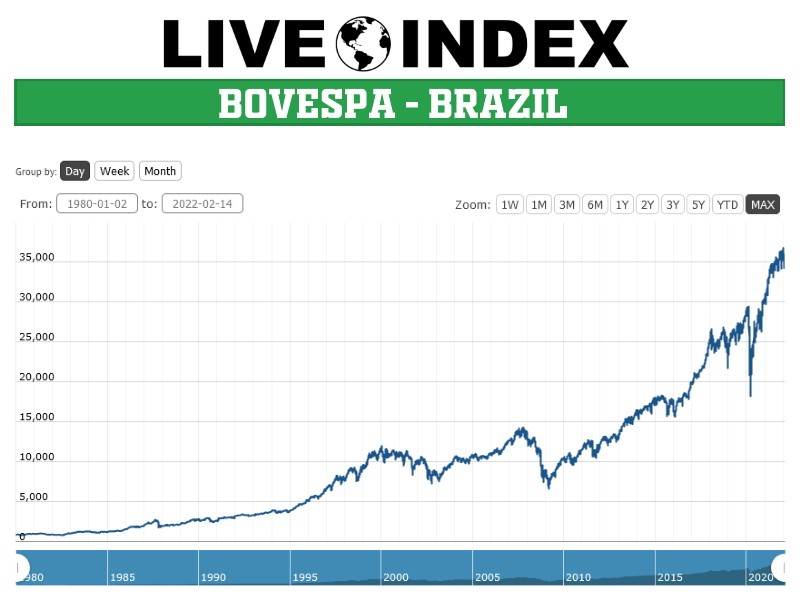
Bovespa : Historical Chart
Related News


The Bovespa Index of Brasil is an index of about 50 stocks that are traded on the São Paulo Stock, Mercantile & Futures Exchange.
The index is composed by a theoretical portfolio with the stocks that accounted for 80% of the volume traded in the last 12 months and that were traded at least on 80% of the trading days. It’s revised quarterly, in order to keep its representativeness of the volume traded and in average the components of Ibovespa represent 70% of the all the stock value traded.
BOVESPA is an accumulation index. Its index number represents the present value of a portfolio begun on 2 January 1968, with a starting value of 100 and taking into account share price increases plus the reinvestment of all dividends, subscription rights and bonus stocks received.
The index has been adjusted as follows:
- 1 – division by 100, on 3 October 1983
- 2 – division by 10, on 2 December 1985
- 3 – division by 10, on 29 August 1988
- 4 – division by 10, on 14 April 1989
- 5 – division by 10, on 12 January 1990
- 6 – division by 10, on 28 May 1991
- 7 – division by 10, on 21 January 1992
- 8 – division by 10, on 26 January 1993
- 9 – division by 10, on 27 August 1993
- 10 – division by 10, on 10 February 1994
- 11 – division by 10, on 3 March 1997.
Bovespa - Ibovespa Index | Bovespa Live Quotes | Brazil Index
Live Price of Bovespa. Bovespa Live Chart, Bovespa Intraday & Historical Live Chart. Bovespa Buy Sell Signal, Bovespa News, Bovespa Videos, Bovespa Averages, Returns & Historical Data
» Bovespa
» Bovespa Real Time Quotes
» Bovespa Live Chart
» Bovespa Intraday Chart
» Bovespa Historical Chart
» Bovespa Buy Sell Signal
» Bovespa News
» Bovespa Videos
» Bovespa Averages
» Bovespa Returns
» Bovespa Historical Data