
| Symbol | Last | Change | % | High | Low |
|---|---|---|---|---|---|
| AUD / JPY | 114.29 | +0.16 | +0.14% | 114.47 | 113.98 |
| Open Last Trade : 10:07 | GMT Time : Thu Jul 23 2026 10:07 | ||||
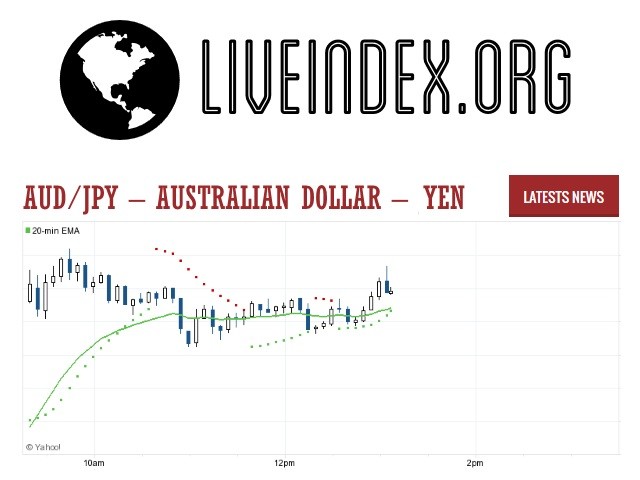
AUD/JPY : Intraday Live Chart
AUD/JPY : Technical Signal Buy & Sell
| 5 Min Signal | 1 Hour Signal | 1 Day Signal |
|---|---|---|
| Buy | Buy | Buy |
AUD/JPY : Moving Averages
| Period | MA 20 | MA 50 | MA 100 |
|---|---|---|---|
| 5 Minutes | 114.33 | 114.32 | 114.35 |
| 1 Hour | 114.18 | 114.16 | 113.86 |
| 1 Day | 112.86 | 112.76 | 113.18 |
| 1 Week | 112.44 | 105.68 | 101.69 |
AUD/JPY : Technical Resistance Level
| Resistance 1 - R1 | Resistance 2 - R2 | Resistance 3 - r3 |
|---|---|---|
| 114.18 | 114.28 | 114.33 |
AUD/JPY : Technical Support Level
| Support 1 - S1 | Support 2 - S2 | Support 3 - S3 |
|---|---|---|
| 114.03 | 113.98 | 113.88 |
AUD/JPY : Periodical High, Low & Average
| Period | High Change from Last | Low Change from Last | Average Change from Last |
|---|---|---|---|
| 1 Week | 114.27 +0.02 | 0.00 +114.29 | 113.67 +0.62 |
| 1 Month | 114.27 +0.02 | 0.00 +114.29 | 112.51 +1.78 |
| 3 Month | 114.83 -0.54 | 0.00 +114.29 | 113.15 +1.14 |
| 6 Month | 114.83 -0.54 | 0.00 +114.29 | 111.82 +2.47 |
| 1 Year | 114.83 -0.54 | 0.00 +114.29 | 105.62 +8.67 |
AUD/JPY : Historical Chart
Related News


AUD to JPY Exchange Rate History: Risk Currency Meets Ultra-Low Yield Haven
The AUD to JPY exchange rate is a classic representation of global risk sentiment. The Australian Dollar (AUD), driven by commodities and high interest rates, contrasts sharply with the Japanese Yen (JPY)—a long-standing safe-haven with persistently low yields. As such, AUD/JPY is highly sensitive to market volatility, carry trade dynamics, and central bank policy divergence.
1990s: Diverging Fundamentals Begin
In the 1990s:
Japan grappled with deflation and slow growth following the asset bubble collapse.
The Bank of Japan (BOJ) moved toward zero interest rates, while the Reserve Bank of Australia (RBA) kept relatively higher rates.
AUD/JPY moved between 60 and 85, fluctuating based on risk cycles and economic reforms in both nations. The pair remained volatile, with JPY periodically strengthening during global stress events.
2000–2007: Carry Trade Boom
This period saw the rise of the carry trade, where investors borrowed in low-yielding JPY to invest in high-yielding AUD.
AUD/JPY climbed from 60 to 107 between 2000 and mid-2007.
Australia’s mining boom and strong interest rate differential made AUD extremely attractive.
This was one of the most profitable carry trades of the decade—until the financial crisis erupted.
2008–2012: Crisis and Unwinding
The 2008 Global Financial Crisis caused:
A massive unwinding of carry trades.
A sharp plunge in AUD/JPY from 107 to 55 in late 2008.
JPY strengthened aggressively as investors sought safe assets, while AUD crashed amid falling commodity prices and risk aversion.
The recovery was uneven, with AUD/JPY bouncing between 70 and 90 during this period, depending on global confidence and Japan’s domestic policy challenges.
2013–2019: Abenomics and AUD Moderation
Under Prime Minister Abe, Japan launched massive QE under the “Abenomics” program.
BOJ policy remained extremely loose, but Australia’s economy also began slowing post-mining boom.
AUD/JPY remained relatively stable in the 80–95 range, with brief surges toward 100 in 2014.
Low volatility and synchronized global growth kept the pair range-bound.
2020–2024: Pandemic, Inflation, and BOJ Shift
In 2020, COVID-19 caused another AUD/JPY collapse from 76 to 60, but stimulus-fueled recovery led to a strong rebound.
By 2021–2022, AUD surged as the RBA hiked rates while the BOJ stuck to ultra-loose policies.
AUD/JPY peaked at 98 in 2022, its highest since 2013.
However, by 2023–2024, the BOJ began signaling policy normalization, introducing yield curve adjustments, causing renewed JPY strength.
As of April 2025, AUD/JPY trades near 95, as traders price in future BOJ tightening and potential RBA rate cuts.
✅ Key
🟢 = AUD appreciated vs JPY
❌ = AUD depreciated vs JPY
⚠️ = Mixed / Volatile
📊 AUD to JPY Exchange Rate by Decade
| Decade | Avg. AUD/JPY Rate (Approx) | Change vs. Previous Decade | Key Events |
|---|---|---|---|
| 1990s | 60 – 85 | ⚠️ Volatile | Japan’s deflation, early carry trades |
| 2000s | 60 → 107 → 55 | 🟢 then ❌ Sharp reversal | Carry trade boom & GFC crash |
| 2010s | 70 – 95 | ⚠️ Recovery phase | Abenomics, low volatility |
| 2020s (till 2025) | 60 → 98 → 95 | 🟢 Net gain | Pandemic recovery, RBA hikes, BOJ policy shift |
The AUD/JPY pair continues to be a strong barometer of global investor sentiment. If the BOJ accelerates tightening, we may see JPY strength return, pushing the pair down. Conversely, if risk appetite improves and the RBA stays hawkish, AUD could push back toward parity with JPY.
AUD/JPY - Australian Dollar / Japanese Yen Currency Rate
Live Price of AUD/JPY. AUD/JPY Live Chart, Intraday & Historical Live Chart, Buy Sell Signal, AUD/JPY News, AUD/JPY Averages, Returns & Historical Data
» AUD/JPY
» AUD/JPY Real Time Quotes
» AUD/JPY Live Chart
» AUD/JPY Intraday Chart
» AUD/JPY Historical Chart
» AUD/JPY Buy Sell Signal
» AUD/JPY News
» AUD/JPY Videos
» AUD/JPY Averages
» AUD/JPY Currency Pair
» AUD/JPY Historical Data