When will the market’s long-awaited Sell-off begin?
All major U.S. indices closed lower last week, except for the small-cap Russell 2000. This followed two weeks of mostly sideways, non-directional trading.
The Nasdaq continues to negotiate its March 2000 tech-bubble highs amid historically low volatility. Both of these factors continue to warn of the broader market’s vulnerability to at least a minor pullback between now and the end of the third quarter.
Internally, the market may actually be more vulnerable than it looks. All sectors of the S&P 500 except for financials and technology finished in negative territory last week, led lower by utilities (-2.2%) and health care (-1.7%).
However, there is one potential bright spot. The table below, which displays Asbury Research’s metric for tracking investor asset flows in the State Street SPDR sector ETFs, shows that the largest inflows over the past one-week and one-month periods went into energy.
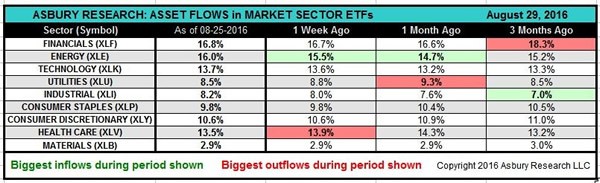
As long as these inflows into energy stocks continue, it bodes well for more strength from this economically sensitive sector, which, like materials and industrials, is correlated to the U.S. economy and the broader stock market.
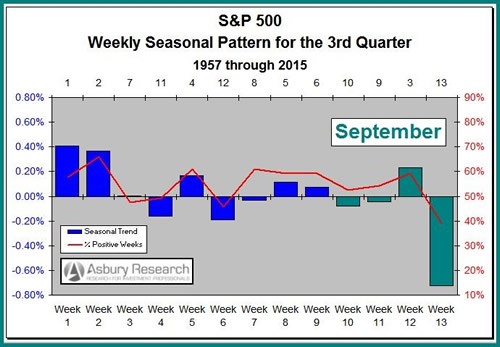
Seasonality Turns Negative in September
For the past month, I have been warning of the stock market’s vulnerability to a correction due to a growing number of factors. These include formidable overhead resistance in the market-leading Nasdaq 100 at 4,816, historically low put-to-call ratios, and an extreme in investor complacency according to the Volatility S&P 500 Index (VIX). Now we can add negative seasonality to the list.
September includes three of the five poorest performing weeks of the entire third quarter in the S&P 500 based on data since 1957. Historically, the most acute weakness has come at the end of the month. The index has posted a negative weekly close 61% of the time in the final week of September and, on average, it has closed 0.7% lower.
Editor’s note: As John said in last week’s report, the next pullback is likely to be a buying opportunity. If we are headed for a decline in September, now is the time to prepare to ensure you don’t miss out when stocks go on sale. An expert with a 96% win rate can help you get ready.
Investor Fear Remains the Trigger
Now that we know when this long-awaited sell-off is most likely to emerge, the next question is: What will get us there? The answer is investor fear.
One distinctive characteristic of the stock market this summer has been low volatility. With the exception of three weeks in June, the VIX has been hovering near 12, indicating an extreme in investor complacency that tells us investors are collectively unconcerned about a market decline. However, there is now some evidence that suggests this period of complacency may be coming to an end.
The VIX finished last week just below its 50-day moving average, which is currently situated at 14.10. I use the 50-day moving average as a line of demarcation between periods of investor complacency (below 50-day) and investor fear (above 50-day).
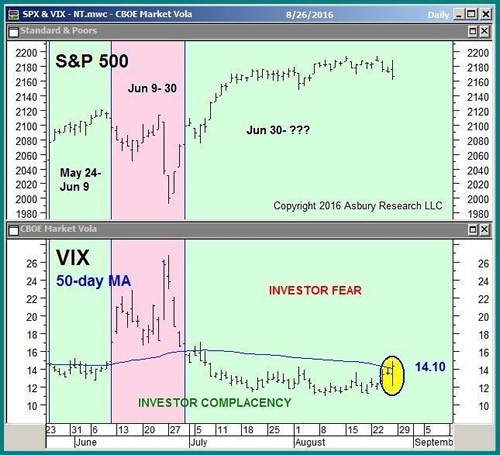
So, I would view a sustained rise above 14.10 in the VIX this week as evidence that there is enough fear in the marketplace to trigger a countertrend decline in the S&P 500.
Benchmark Interest Rates at an Inflection Point
For the past month, I have been stating that long-term U.S. interest rates appeared to be bottoming. I’ve also said that once investors got over the initial shock of rising rates, they would realize it is actually a sign of an improving economy that should ultimately be a positive for the stock market.
The next chart shows that the yield of the benchmark 10-year Treasury note finished last week at 1.62%, right in the middle of important resistance at 1.60% to 1.63%.
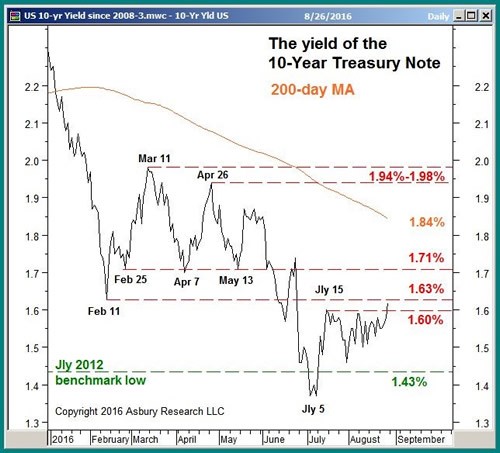
A sustained move above 1.63% would clear the way for more strength and a test of the next level at 1.71%, which represents three important closing lows set between late February and mid-May. A rise above 1.71% would also set the stage for a move to the 200-day moving average, currently at 1.84%. If this widely watched major trend proxy is broken, it will indicate the intermediate-term trend for long-term interest rates has turned positive.
Precious Metals Still Vulnerable
In last week’s Market Outlook, I discussed what appeared to be an emerging decline in silver prices. I said that a sustained move below $ 19.27 in silver futures would confirm a bearish double-top pattern, at the July 4 and Aug. 2 highs, which would target a decline to $ 17.70.
That pattern was confirmed when silver futures closed at $ 19.01 on Aug. 22. They then proceeded to decline to a close of $ 18.75 on Friday. The $ 17.70 downside target remains intact and sits 5.6% below Friday’s close.
The next chart shows that positively correlated gold prices also made a confirming breakdown last week. The SPDR Gold Shares (NYSE: GLD) collapsed below almost-two-months of sideways investor indecision to indicate that a meaningful peak was in place at the $ 131.15 July 6 high.
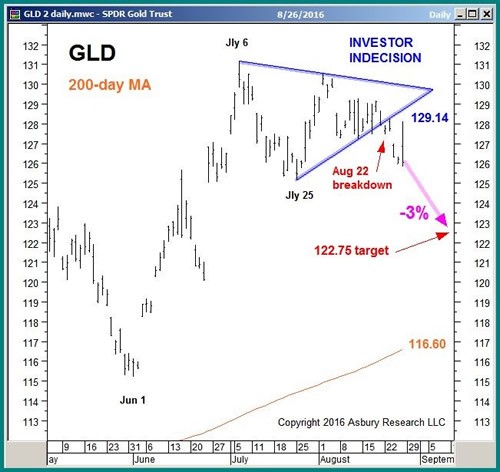
The pattern targets a decline to $ 122.75, about 3% below Friday’s close, that will remain valid as long as the lower boundary of the indecision area at $ 129.14 contains as overhead resistance.
Although the major trend in gold is still bullish, this pattern suggests that investors remain on the sidelines in precious metals. Once the downside targets are met, precious metals may once again begin to show some signs of life.
Putting It All Together
The market-leading Nasdaq 100’s inability to remain above its 4,816 tech-bubble high last week, combined with negative September seasonality in the benchmark S&P 500, sets the stage for an overdue corrective decline over the next several weeks. And it is likely to be triggered by a sustained rise above 14.10 in the VIX.
In the bigger picture, though, I believe the expected decline will be corrective as opposed to directional, and will eventually lead to a better intermediate-term buying opportunity.