
| Symbol | Last | Change | % | High | Low |
|---|---|---|---|---|---|
| NASDAQ – US | 24,876.9 | -55.2 | -0.22% | 24,984.5 | 24,581.0 |
| Close | US Time : Wed Jul 29 2026 03:47 | ||||
Nasdaq Composite : Intraday Live Chart
Nasdaq Composite : Technical Signal Buy & Sell
| 5 Min Signal | 1 Hour Signal | 1 Day Signal |
|---|---|---|
| Sell | Sell | Sell |
Nasdaq Composite : Moving Averages
| Period | MA 20 | MA 50 | MA 100 |
|---|---|---|---|
| 5 Minutes | 24878.66 | 24897.15 | 24861.86 |
| 1 Hour | 24886.38 | 24932.73 | 24954.96 |
| 1 Day | 25644.04 | 25799.19 | 25765.39 |
| 1 Week | 24663.95 | 23556.96 | 21199.10 |
Nasdaq Composite : Technical Resistance Level
| Resistance 1 - R1 | Resistance 2 - R2 | Resistance 3 - r3 |
|---|---|---|
| 25,012.7 | 25,228.6 | 25,416.2 |
Nasdaq Composite : Technical Support Level
| Support 1 - S1 | Support 2 - S2 | Support 3 - S3 |
|---|---|---|
| 24,609.2 | 24,421.6 | 24,205.7 |
Nasdaq Composite : Periodical High, Low & Average
| Period | High Change from Last | Low Change from Last | Average Change from Last |
|---|---|---|---|
| 1 Week | 25,841.3 -964.4 | 24,581.0 +295.9 | 25,080.7 -203.8 |
| 1 Month | 26,316.8 -1,439.9 | 24,581.0 +295.9 | 25,729.0 -852.1 |
| 3 Month | 27,190.2 -2,313.3 | 24,491.8 +385.1 | 25,928.5 -1,051.6 |
| 6 Month | 27,190.2 -2,313.3 | 20,690.2 +4,186.7 | 24,426.0 +450.9 |
| 1 Year | 27,190.2 -2,313.3 | 20,560.2 +4,316.7 | 23,534.8 +1,342.1 |
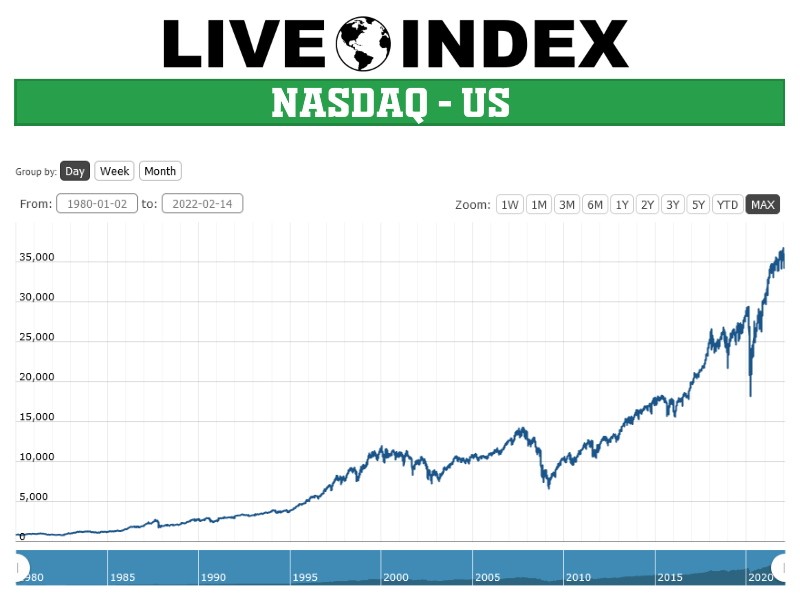
Nasdaq Composite : Historical Chart
Related News


A >> The NASDAQ composite is an index composed of over 2,500 securities listed in the NASDAQ exchange.
NASDAQ composite index includes all listed stocks, limited partnerships, real estate investment trusts and American Depository Receipts.
However not included are any closed-end funds, exchange-traded funds, convertible securities, preferred shares or derivative securities listed on the exchange.
The NASDAQ Composite is classified as a broad-based stock market index and is sometimes called the NASDAQ average.
A >> Sometimes people confuse them with each other. There are two NASDAQ stock indexes – the NASDAQ Composite and the NASDAQ 100.
The NASDAQ composite is an index composed of over 3,000 securities listed in the NASDAQ exchange. It includes all listed stocks, limited partnerships, real estate investment trusts and American Depository Receipts.
Where as NASDAQ 100 index is an index, which is composed of 100 or 107 largely traded United States companies. These companies are non-financial companies and are listed on the NASDAQ.
A >> NASDAQ Composite came into being on 31 January 1985.
This index is owned by “NASDAQ” which created two different indices, NASDAQ Composite index and NASDAQ Financial 100.
At the beginning of Nasdaq Composite index, the base price for the index was set as 250, but at the end of first year i.e. Dec 31, 1993 the base price was reset at 125.
Foreign companies were first time admitted to this index in January 1998.
Nasdaq Composite closed above the 1,000 mark for the first time on July 17, 1995. By 1998 it reached value of 2,000.
Thereafter it accelerated the pace and index reach 3,000 by late 1999, and to close that year at 4,069.31 points.
The index finally peaked at an intra-day high of 5,132.52, and closed at an all-time high of 5,048.62 on March 10, 2000.
The decline from this peak of above 5000 signaled the beginning of the dot-com bubble burst.
The Nasdaq Composite declined to half its value within a year. Thereafter it hit the bottom of the bear market with an intra-day low of 1,108.49 on October 10, 2002.
While the index gradually recovered since then, it did not trade for more than half of its peak value until May 2007.
Thereafter Nasdaq Composite reached an intra-day level of 2,861.51 on October 31, 2007, the highest point reached on the index since 2001.
Again, high energy prices, the failure of Lehman Brothers and the possibility of recession dropped the NASDAQ Composite into a bear market in 2008.
On September 29, 2008, the NASDAQ dropped nearly 200 points, losing 9.14% (third largest in history) to fall beneath the 2,000 level.
With the resurgence of tech stocks, the index again passed the 3000 milestone intra-day on February 29, 2012 ending 2012 with a total of 3,019.51 points.
On April 23 , 2015, Nasdaq Composite reached a record high on Thursday, closing above a record high set 15 years ago on March 10, 2000 during the height of the dotcom tech bubble.
A >> The most important different between Nasdaq Composite & DJIA or S&P500 is that NASDAQ Composite is primarily focused on technology-based corporations such as Apple, Amazon, Google, Microsoft, Netflix and several other tech companies.
Whereas all other major indices are diversified and more inclined towards industrials / financials.
A >> Some of the names / alias are used for NASDAQ Composite are
NASDAQ
IXIC
QQQQ
NASDAQ Futures
E-mini NASDAQ
QQQQ
NASDAQ Live
NASDAQ Aftermarket
Nasdaq - Nasdaq Composite Index | Nasdaq Composite Live Quotes | US Index
Live Price of Nasdaq. Nasdaq Live Chart, Nasdaq Intraday & Historical Live Chart. Nasdaq Buy Sell Signal, Nasdaq News, Nasdaq Videos, Nasdaq Averages, Returns & Historical Data
» Nasdaq
» Nasdaq Real Time Quotes
» Nasdaq Live Chart
» Nasdaq Intraday Chart
» Nasdaq Historical Chart
» Nasdaq Buy Sell Signal
» Nasdaq News
» Nasdaq Videos
» Nasdaq Averages
» Nasdaq Returns
» Nasdaq Historical Data