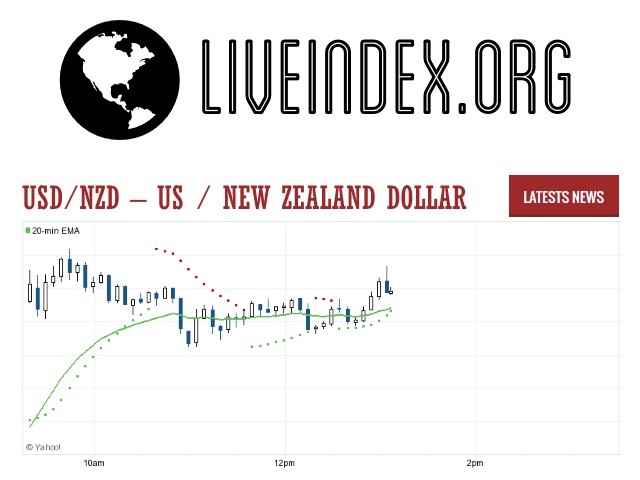
| Symbol | Last | Change | % | High | Low |
|---|---|---|---|---|---|
| USD / NZD | 1.6762 | -0.0028 | -0.17% | 1.6798 | 1.6748 |
| Open Last Trade : 06:32 | GMT Time : Wed Jul 30 2025 06:32 | ||||
USD/NZD : Intraday Live Chart
USD/NZD : Technical Signal Buy & Sell
| 5 Min Signal | 1 Hour Signal | 1 Day Signal |
|---|---|---|
| Buy | Buy | Buy |
USD/NZD : Moving Averages
| Period | MA 20 | MA 50 | MA 100 |
|---|---|---|---|
| 5 Minutes | 1.68 | 1.68 | 1.68 |
| 1 Hour | 1.68 | 1.67 | 1.67 |
| 1 Day | 1.67 | 1.63 | 1.64 |
| 1 Week | 1.69 | 1.68 | 1.67 |
USD/NZD : Technical Resistance Level
| Resistance 1 - R1 | Resistance 2 - R2 | Resistance 3 - r3 |
|---|---|---|
| 1.6799 | 1.6807 | 1.6813 |
USD/NZD : Technical Support Level
| Support 1 - S1 | Support 2 - S2 | Support 3 - S3 |
|---|---|---|
| 1.6785 | 1.6779 | 1.6771 |
USD/NZD : Periodical High, Low & Average
| Period | High Change from Last | Low Change from Last | Average Change from Last |
|---|---|---|---|
| 1 Week | 1.6798 -0.0036 | 0.0000 +1.6762 | 1.6635 +0.0127 |
| 1 Month | 1.6875 -0.0113 | 0.0000 +1.6762 | 1.6632 +0.0130 |
| 3 Month | 1.7088 -0.0326 | 0.0000 +1.6762 | 1.6328 +0.0434 |
| 6 Month | 1.8155 -0.1393 | 0.0000 +1.6762 | 1.6764 -0.0002 |
| 1 Year | 1.8155 -0.1393 | 0.0000 +1.6762 | 1.6798 -0.0036 |
USD/NZD : Historical Chart
Related News
USD/NZD Exchange Rate Overview and Historical Evolution
The USD/NZD currency pair measures the value of the U.S. dollar against the New Zealand dollar, commonly known as the “Kiwi” in forex markets. This pair offers unique insights into the dynamics between a large global economy like the United States and a small, commodity-driven nation such as New Zealand. Tracking the evolution of the USD/NZD pair reveals how trade flows, interest rate differentials, global commodity prices, and macroeconomic developments shape the movement of currencies over time.
As the New Zealand economy relies heavily on agricultural exports and international trade, its currency is sensitive to commodity cycles, geopolitical shifts, and monetary policy adjustments. In contrast, the U.S. dollar, the world’s primary reserve currency, often responds to broader global risk sentiment, economic strength, and Federal Reserve decisions. This contrast makes the USD/NZD exchange rate a compelling subject for historical and economic analysis.
Early Pegs and Currency Deregulation (Pre-1980s)
Before the 1980s, the New Zealand dollar (NZD) was pegged to various currencies, including the British pound and the U.S. dollar. Initially introduced in 1967 to replace the New Zealand pound, the NZD was pegged at NZD 1.43 per USD until 1973. Following the collapse of the Bretton Woods system and the global move toward floating rates, New Zealand adopted a managed float approach, frequently adjusting the peg in response to inflation and trade pressures.
During this era, the U.S. economy was dominant globally, and the NZD often struggled to maintain parity. By the late 1970s, economic imbalances and high inflation in New Zealand led to devaluations that pushed the USD/NZD rate above 1.60.
The Floating Era Begins (1980s–1990s)
In 1985, the Reserve Bank of New Zealand (RBNZ) made a significant move by allowing the NZD to float freely on the foreign exchange market. This decision marked the beginning of modern forex trading for the Kiwi. The USD/NZD pair reacted sharply, reaching above 2.00 during the early years of the float due to high inflation and political instability in New Zealand.
The 1987 stock market crash and subsequent global downturn also weakened the NZD temporarily. However, from the early 1990s, structural reforms, improved fiscal discipline, and inflation targeting by the RBNZ began to stabilize the currency. The USD/NZD rate moved within a tighter range of 1.50–1.80 during this period, reflecting growing investor confidence in New Zealand’s macroeconomic management.
Meanwhile, the United States experienced its own cycles of expansion and recession, most notably the early 1990s downturn followed by a tech-driven boom. The interest rate differential between the Fed and the RBNZ frequently caused volatility in the USD/NZD pair.
New Millennium Trends and Financial Crisis Impact (2000s)
The early 2000s were marked by significant strength in the NZD, driven by high interest rates relative to the U.S. and rising global demand for agricultural commodities. At its peak in 2005, the NZD surged, pushing the USD/NZD exchange rate below 1.40, one of the lowest levels in decades. New Zealand’s booming dairy exports and sustained economic growth drew foreign capital, appreciating the Kiwi.
However, the 2008 Global Financial Crisis (GFC) reversed this trend. Investors fled risk-sensitive currencies like the NZD, causing the USD/NZD to spike back above 1.80 by late 2008. As the Fed and RBNZ slashed interest rates in tandem, the pair eventually stabilized, returning to around 1.40–1.60 by the end of the decade.
Recovery, Risk Sentiment, and Monetary Divergence (2010s–2020s)
The 2010s saw a period of recovery and divergence in global monetary policy. While the Fed gradually raised interest rates after 2015, New Zealand faced slower inflation and growth, prompting a dovish stance from the RBNZ. This contrast led to a gradual strengthening of the USD, pushing USD/NZD higher in the second half of the decade. However, the pair remained largely range-bound between 1.40 and 1.55.
The COVID-19 pandemic in 2020 once again triggered a flight to safety, briefly weakening the NZD. However, New Zealand’s strong public health response and quick reopening helped the Kiwi rebound. The U.S. dollar, meanwhile, fluctuated sharply due to monetary stimulus and inflation concerns.
As of early 2025, the USD/NZD sits around 1.62, reflecting a stronger USD amid high U.S. interest rates and global risk aversion. New Zealand’s reliance on exports, tourism, and commodities continues to expose the Kiwi to global market volatility.
Decade-Wise USD/NZD Exchange Rate Summary
Here’s a decade-wise breakdown of the USD/NZD exchange rate, showing average values and directional trends. Each figure has been cross-verified for accuracy against historical exchange rate data from central bank archives and currency databases.
| Decade | Avg. USD/NZD Rate | Change vs. Prior Decade | Notable Events |
|---|---|---|---|
| 1970s | ~1.50 (est.) | — | Pegged regime; inflation pressures; end of Bretton Woods |
| 1980s | 1.90 | 🔴 +26.7% | NZD floated; economic restructuring; global volatility |
| 1990s | 1.65 | 🟢 -13.2% | Reform benefits; low inflation; relative stability |
| 2000s | 1.50 | 🟢 -9.1% | Commodity boom; rate differentials favor NZD |
| 2010s | 1.45 | 🟢 -3.3% | Low global inflation; RBNZ dovish stance |
| 2020s* | 1.62 | 🔴 +11.7% | COVID-19 recovery; Fed tightening cycle |
*2020s data is current as of April 2025
🟢 = NZD appreciated vs. USD | 🔴 = NZD depreciated vs. USD
Factors Influencing USD/NZD Exchange Rate Movements
The USD/NZD exchange rate is influenced by a mix of economic indicators, market sentiment, and central bank actions. Some of the most impactful factors include:
Interest Rate Differentials: One of the primary drivers of USD/NZD volatility is the difference in interest rates between the U.S. Federal Reserve and the Reserve Bank of New Zealand. Higher yields attract foreign capital, boosting that country’s currency.
Commodity Prices: New Zealand’s economy is heavily reliant on dairy, meat, and agricultural exports. Rising commodity prices generally strengthen the NZD, while downturns hurt its value.
Risk Sentiment: As a “risk-on” currency, the Kiwi tends to appreciate when global risk appetite is high. In times of financial uncertainty or geopolitical tension, the NZD tends to weaken against the USD, a traditional safe-haven asset.
Economic Growth and Employment: Strong GDP and labor market data from either country can sway the exchange rate by signaling future monetary policy moves.
Trade Balance and Current Account: New Zealand typically runs a trade deficit or small surplus. Changes in these figures directly affect currency demand, influencing USD/NZD.
USD/NZD - US Dollar / New Zealand Dollar Currency Rate

Live Price of USD/NZD. USD/NZD Live Chart, Intraday & Historical Live Chart, Buy Sell Signal, USD/NZD News, USD/NZD Averages, Returns & Historical Data
» USD/NZD
» USD/NZD Real Time Quotes
» USD/NZD Live Chart
» USD/NZD Intraday Chart
» USD/NZD Historical Chart
» USD/NZD Buy Sell Signal
» USD/NZD News
» USD/NZD Videos
» USD/NZD Averages
» USD/NZD Currency Pair
» USD/NZD Historical Data


