
| Symbol | Last | Change | % | High | Low |
|---|---|---|---|---|---|
| USD / AUD | 1.4380 | +0.0123 | +0.86% | 1.4411 | 1.4237 |
| Open Last Trade : 18:05 | GMT Time : Tue Mar 24 2026 18:05 | ||||
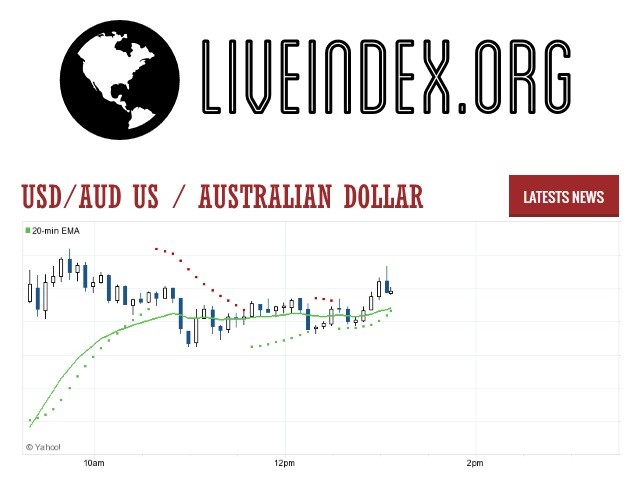
USD/AUD : Intraday Live Chart
USD/AUD : Technical Signal Buy & Sell
| 5 Min Signal | 1 Hour Signal | 1 Day Signal |
|---|---|---|
| Buy | Buy | Sell |
USD/AUD : Moving Averages
| Period | MA 20 | MA 50 | MA 100 |
|---|---|---|---|
| 5 Minutes | 1.44 | 1.44 | 1.44 |
| 1 Hour | 1.43 | 1.41 | 1.41 |
| 1 Day | 1.41 | 1.42 | 1.46 |
| 1 Week | 1.48 | 1.52 | 1.52 |
USD/AUD : Technical Resistance Level
| Resistance 1 - R1 | Resistance 2 - R2 | Resistance 3 - r3 |
|---|---|---|
| 1.4282 | 1.4304 | 1.4327 |
USD/AUD : Technical Support Level
| Support 1 - S1 | Support 2 - S2 | Support 3 - S3 |
|---|---|---|
| 1.4237 | 1.4214 | 1.4192 |
USD/AUD : Periodical High, Low & Average
| Period | High Change from Last | Low Change from Last | Average Change from Last |
|---|---|---|---|
| 1 Week | 1.4282 +0.0098 | 1.4237 +0.0143 | 1.4267 +0.0113 |
| 1 Month | 1.4360 +0.0020 | 0.0000 +1.4380 | 1.4147 +0.0233 |
| 3 Month | 1.4995 -0.0615 | 0.0000 +1.4380 | 1.4474 -0.0094 |
| 6 Month | 1.5533 -0.1153 | 0.0000 +1.4380 | 1.4893 -0.0513 |
| 1 Year | 1.6832 -0.2452 | 0.0000 +1.4380 | 1.5173 -0.0793 |
USD/AUD : Historical Chart
Related News


USD to AUD Exchange Rate History: Decades of Dollar vs. Aussie Dollar Trends
The USD to AUD exchange rate is a key metric in global forex trading and economic strategy, representing the relationship between the U.S. dollar and the Australian dollar. Often influenced by interest rate differentials, commodity cycles, and geopolitical events, the USD/AUD pair is a reflection of both macroeconomic fundamentals and global risk sentiment. With Australia being a major commodity exporter and the U.S. a global financial hub, the pair’s history offers insights into global economic shifts.
1970s–1980s: Pegs, Floating, and Economic Transition
In the early 1970s, Australia transitioned from the sterling peg to a U.S. dollar peg, followed by a trade-weighted basket. Finally, in December 1983, Australia adopted a fully floating exchange rate. This shift allowed market forces to guide the AUD, bringing increased volatility and responsiveness to global trends.
During the 1980s, the AUD was particularly sensitive to interest rate differentials and U.S. monetary policy. The U.S. dollar’s strength under Paul Volcker’s Fed and Australia’s economic reforms led to sharp fluctuations. The USD/AUD ranged between 1.00 and 1.50 during the 1980s, driven by capital inflows, inflation control, and reforms.
1990s: Reform Payoff and Range-Bound Trading
The 1990s saw Australia reap the benefits of its earlier economic reforms. A more stable monetary policy framework, low inflation, and increased transparency helped the AUD find footing. The USD/AUD fluctuated mostly between 1.25 and 1.75 during the decade.
Despite some volatility driven by the Asian Financial Crisis in 1997 and changes in global commodity demand, Australia’s proximity to Asia helped keep the AUD relatively resilient. While the U.S. enjoyed a tech-driven boom, the Aussie dollar remained range-bound due to slower growth and limited monetary tightening.
2000s: Commodity Supercycle and Record Highs
The early 2000s began with a weakened Aussie, with USD/AUD peaking around 2.00 in 2001. However, China’s rapid growth and increased demand for Australian commodities (especially iron ore and coal) marked the beginning of a commodity supercycle.
From 2002 onward, the Australian dollar rallied consistently. By 2008, the USD/AUD had fallen below parity, with the AUD reaching historic highs. In July 2011, the Aussie hit an all-time high near 1.10 against the U.S. dollar. Strong economic growth, high interest rates, and booming exports contributed to this unprecedented surge.
However, the 2008 Global Financial Crisis caused a sharp, temporary reversal. The USD/AUD fell from 0.96 to 1.50 in months before recovering in 2009 thanks to stimulus and renewed Chinese demand.
2010s: End of Boom and Monetary Divergence
The 2010s marked a gradual weakening of the Aussie dollar. As commodity prices peaked and then declined, Australia’s terms of trade worsened. Meanwhile, the U.S. economy recovered and began raising interest rates while the Reserve Bank of Australia (RBA) maintained a dovish stance.
By 2014–2015, the end of the mining investment boom was evident. The USD/AUD rate shifted from 0.90 to 1.30. U.S. rate hikes and falling Chinese demand for raw materials kept pressure on the Aussie.
From 2016 to 2019, the pair traded between 1.25 and 1.45, with AUD volatility tied closely to global trade tensions, Fed guidance, and Australian housing data.
2020–2024: Pandemic, Recovery, and Inflation Pressures
The COVID-19 pandemic in 2020 shook global markets. Initially, the U.S. dollar surged on safe-haven demand, and the USD/AUD shot up from 1.45 to nearly 1.65 in March 2020. However, Australia’s effective containment strategy and rebound in commodity exports led to a recovery.
By mid-2021, the AUD had strengthened, and USD/AUD dropped back to near 1.30. As inflation surged globally in 2022, central banks, including the RBA and the Fed, began aggressive tightening cycles.
While U.S. rates remained higher through 2023, Australia’s commodity-linked economy showed resilience. Still, weaker Chinese growth and global slowdown fears in 2024 kept the AUD under pressure. As of April 2025, the USD/AUD trades around 1.51.
✅ Key:
🟢 = Australian dollar appreciated vs USD
❌ = Australian dollar depreciated vs USD
⚠️ = Minimal change / Range-bound
📊 USD to AUD Exchange Rate by Decade
| Decade | Avg. USD/AUD Rate (Approx) | Change vs. Previous Decade | Key Events |
|---|---|---|---|
| 1970s | 1.00 (fixed peg early) | ⚠️ N/A (transition decade) | Bretton Woods collapse, AUD float begins |
| 1980s | 1.00 → 1.45 | ❌ -31% AUD depreciation | Floating regime, reforms, U.S. rate hikes |
| 1990s | 1.45 → 1.55 | ⚠️ Flat / slight AUD loss | Stable policy, Asian crisis, trade dependence |
| 2000s | 1.55 → 0.90 | 🟢 +42% AUD appreciation | Commodity boom, China effect, record AUD highs |
| 2010s | 0.90 → 1.40 | ❌ -36% AUD depreciation | End of supercycle, Fed hikes, Aussie slowdown |
| 2020s (till 2025) | 1.40 → 1.51 | ⚠️ Range-bound | Pandemic, global tightening, China slowdown |
USD/AUD - US Dollar / Australian Dollar Currency Rate
Live Price of USD/AUD. USD/AUD Live Chart, Intraday & Historical Live Chart, Buy Sell Signal, USD/AUD News, USD/AUD Averages, Returns & Historical Data
» USD/AUD
» USD/AUD Real Time Quotes
» USD/AUD Live Chart
» USD/AUD Intraday Chart
» USD/AUD Historical Chart
» USD/AUD Buy Sell Signal
» USD/AUD News
» USD/AUD Videos
» USD/AUD Averages
» USD/AUD Currency Pair
» USD/AUD Historical Data