
| Symbol | Last | Change | % | High | Low |
|---|---|---|---|---|---|
| US DOLLAR INDEX | 98.999 | +0.349 | +0.35% | 99.183 | 98.995 |
| Open Last Trade : 00:17 | US Time : Mon Apr 13 2026 00:17 | ||||
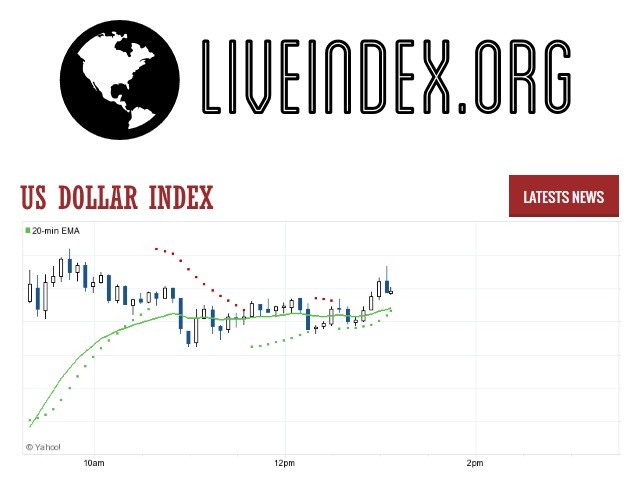
US Dollar Index : Intraday Live Chart
US Dollar Index : Technical Signal Buy & Sell
| 5 Min Signal | 1 Hour Signal | 1 Day Signal |
|---|---|---|
| Sell | Buy | Buy |
US Dollar Index : Moving Averages
| Period | MA 20 | MA 50 | MA 100 |
|---|---|---|---|
| 5 Minutes | 99.02 | 99.03 | 99.06 |
| 1 Hour | 98.81 | 98.79 | 98.80 |
| 1 Day | 99.64 | 98.88 | 97.50 |
| 1 Week | 98.65 | 98.59 | 101.68 |
US Dollar Index : Technical Resistance Level
| Resistance 1 - R1 | Resistance 2 - R2 | Resistance 3 - r3 |
|---|---|---|
| 99.137 | 99.183 | 99.274 |
US Dollar Index : Technical Support Level
| Support 1 - S1 | Support 2 - S2 | Support 3 - S3 |
|---|---|---|
| 99.000 | 98.909 | 98.863 |
US Dollar Index : Periodical High, Low & Average
| Period | High Change from Last | Low Change from Last | Average Change from Last |
|---|---|---|---|
| 1 Week | 100.012 -1.013 | 98.541 +0.458 | 99.052 -0.053 |
| 1 Month | 100.582 -1.583 | 98.541 +0.458 | 99.692 -0.693 |
| 3 Month | 100.582 -1.583 | 95.654 +3.345 | 97.280 +1.719 |
| 6 Month | 100.582 -1.583 | 95.654 +3.345 | 98.193 +0.806 |
| 1 Year | 101.760 -2.761 | 95.654 +3.345 | 98.372 +0.627 |
US Dollar Index : Historical Chart
Related News


The US Dollar Index (USDX) is an index (or measure) of the value of the United States dollar relative to a basket of foreign currencies.
It is a weighted geometric mean of the dollar’s value relative to other select currencies:
Euro (EUR), 57.6% weight
Japanese yen (JPY) 13.6% weight
Pound sterling (GBP), 11.9% weight
Canadian dollar (CAD), 9.1% weight
Swedish krona (SEK), 4.2% weight
Swiss franc (CHF) 3.6% weight
USDX goes up when the US dollar gains “strength” (value) when compared to other currencies.
USDX started in March 1973, soon after the dismantling of the Bretton Woods system. At its start, the value of the US Dollar Index was 100.000. It has since traded as high as 164.7200 in February 1985, and as low as 70.698 on March 16, 2008.
The make up of the “basket” has been altered only once, when several European currencies were subsumed by the euro at the start of 1999. The make up of the “basket” is overdue for revision as China, Mexico, South Korea and Brazil are major trading partners presently which are not part of the index whereas Sweden and Switzerland are continuing as part of the index.
USDX is updated whenever US Dollar markets are open, which is from Sunday evening New York time (early Monday morning Asia time) for 24 hours a day to late Friday afternoon New York time.
USDX can be traded as a futures contract on the IntercontinentalExchange (ICE). It is also available in exchange-traded funds (ETFs), options and mutual funds.
US Dollar Index - Dollar Index Futures | US Dollar Index Live Quotes | Dollar Index
Live Price of US Dollar Index Futures. US Dollar Index Futures Live Chart, Intraday & Historical Chart. Dollar Index Futures Buy & Sell Signal and News & Videos, US Dollar Index Averages, Returns & Historical Data
» US Dollar Index Futures
» Dollar Index Futures Real Time Quotes
» Dollar Index Futures Live Chart
» US Dollar Index Futures Intraday Chart
» US Dollar Index Historical Chart
» US Dollar Index Futures Buy Sell Signal
» Dow Jones Futures News
» US Dollar Index Futures Videos
» US Dollar Index Averages
» US Dollar Index Futures Returns
» US Dollar Index Futures Historical Data