
| Symbol | Last | Change | % | High | Low |
|---|---|---|---|---|---|
| S&P 500 – US | 7,498.96 | -10.24 | -0.14% | 7,525.94 | 7,485.85 |
| Close | US Time : Thu Jul 23 2026 08:02 | ||||
S&P 500 : Intraday Live Chart
S&P 500 : Technical Signal Buy & Sell
| 5 Min Signal | 1 Hour Signal | 1 Day Signal |
|---|---|---|
| Sell | Buy | Buy |
S&P 500 : Moving Averages
| Period | MA 20 | MA 50 | MA 100 |
|---|---|---|---|
| 5 Minutes | 6428.91 | 7066.74 | 7225.56 |
| 1 Hour | 7503.90 | 7497.02 | 7478.14 |
| 1 Day | 7510.30 | 7468.44 | 7370.47 |
| 1 Week | 7173.83 | 6910.43 | 6376.65 |
S&P 500 : Technical Resistance Level
| Resistance 1 - R1 | Resistance 2 - R2 | Resistance 3 - r3 |
|---|---|---|
| 7,520.32 | 7,537.56 | 7,560.41 |
S&P 500 : Technical Support Level
| Support 1 - S1 | Support 2 - S2 | Support 3 - S3 |
|---|---|---|
| 7,480.23 | 7,457.38 | 7,440.14 |
S&P 500 : Periodical High, Low & Average
| Period | High Change from Last | Low Change from Last | Average Change from Last |
|---|---|---|---|
| 1 Week | 7,570.74 -71.78 | 7,431.26 +67.70 | 7,479.75 +19.21 |
| 1 Month | 7,581.50 -82.54 | 7,294.18 +204.78 | 7,476.09 +22.87 |
| 3 Month | 7,620.90 -121.94 | 7,046.55 +452.41 | 7,424.54 +74.42 |
| 6 Month | 7,620.90 -121.94 | 6,316.91 +1,182.05 | 7,129.88 +369.08 |
| 1 Year | 7,620.90 -121.94 | 6,212.69 +1,286.27 | 6,896.31 +602.65 |
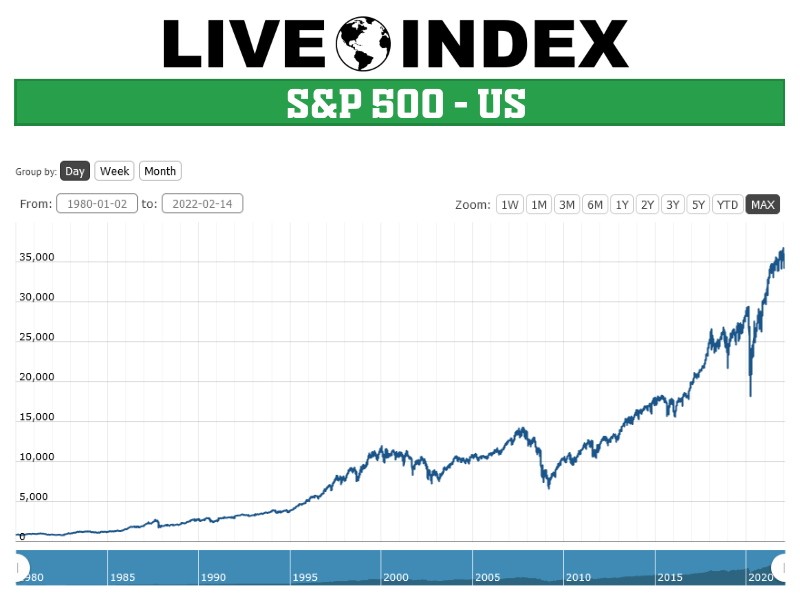
S&P 500 : Historical Chart
Related News


A >> The S&P 500, or the Standard & Poor’s 500, is a Free-Float Capitalization Weighted Index based on the market capitalizations of 500 leading companies publicly traded in the U.S. stock market.
It is one of the most commonly followed equity indices and many consider it the best representation of the market as well as a bellwether for the U.S. economy.
This is a stock market index, which is totally based on the phenomena or method called “Market Capitalization”.
Most of the peoples consider this index the best representation of United States stock market because it is the most followed equity indices in the United States.
Some traders also called it Bellwether of United States Economy.
A >> It differs from other U.S. stock market indices such as the Dow Jones Industrial Average and the NASDAQ due to its diverse constituency and weighting methodology.
This stock index is different from other stock market indices in the United States like NASDAQ composite and Dow Jones Industrial Average due to its two features first one is weighting methodology and second is Diverse Consistency.
Since it has large no of companies (500) which are very diverse and is based on Market Cap, it is considered the best representation of US stock market.
S&P 500 contains both value stocks and growth stocks so that is why it is widely used as an indicator of prices of all stocks.
A >> In 1923, Standard and Poor’s introduced his first stock indices.
The S&P 500 Index in its present form began on March 4, 1957. Before 1957 its primary daily stock market index was the “S&P 90”, a value-weighted index based on 90 stocks.
This index first time closed at 102 on 12, August 1982. On 24, March 2000 during the dot-com bubble, this index reached the peak and this peak was not exceeded over 7 years.
On October 10, 2002, during the stock market downturn, this index declined approximately 50%.
After this, S&P 500 achieved a new all-time high on 11, October 2007 when the index reached a new high of 1576.
However this lasted less than one month. After that, it is dropped to 1400 and not reached the similar level again in 4 years.
Then 2007 Subprime mortgage crisis spread in the whole United states and which also damage the United States Financial Sector and, as a result, on November 20, 2008, the index closed at 752.44, its lowest since early 1997.
This year-to-date loss was the greatest since 1931, when the broad market declined more than 50%; the total losses that ushered in the Great Depression exceeded 80% over a three-year period.
The market continued to decline between late 2008 and early 2009 surrounding the events involving the financial crisis of 2008, reaching a nearly 13-year closing low at 676.53 on March 9, 2009.
On March 23, 2009, the S&P 500 index hit 822.92, marking a 20% gain. The Dow Jones Industrial Average soon followed.
On May 3, 2013, more than thirteen years since its first close above 1500, the S&P 500 closed above 1600 for the first time, closing at 1,614.42.
Then on July 1, 2019, the S&P 500 closed at 2,964 points, which is its all time high till now.
A >> In S&P 500 index there is a committee who select the companies or components for the index. This committee includes numbers of Analysts and Economists.
When Standard and Poor’s is going to add any new component in his index then their committee access the company’s merit using primary criteria.
As S&P 500 is a great representative of industries in United states so the committee of Standard and Poor’s selects the company, which has a higher standing in the United States.
The company is only when added to the index when company satisfies these requirements of standard and poor’s. Some of these are as follows.
1. Market Capitalization of the company must be greater than or equal to 3.5 Billion United States Dollars.
2. Float Adjusted market capitalization must be equal to or greater than 1.0.
3. The company must trade 250,000 shares in every six months.
4. It is a necessary for every company that his Securities must be publicly added to either NASDAQ or NYCE. Some securities are ineligible in this index such as Limited Partnerships, Close-end fund, and ETFs.
A >> Some of the names / alias are used for S&P 500 are
S&P
SPX
S&P 500
S&P Futures
E-mini S&P
SandP 500
S&P Live
Standard and Poor’s 500
S&P 500 - Standard & Poors 500 Index | S&P 500 Live Quotes | US Index
Live Price of S&P 500. S&P 500 Live Chart, S&P 500 Intraday & Historical Live Chart. S&P 500 Buy Sell Signal, S&P 500 News, S&P 500 Videos, S&P 500 Averages, Returns & Historical Data
» S&P 500
» S&P 500 Real Time Quotes
» S&P 500 Live Chart
» S&P 500 Intraday Chart
» S&P 500 Historical Chart
» S&P 500 Buy Sell Signal
» S&P 500 News
» S&P 500 Videos
» S&P 500 Averages
» S&P 500 Returns
» S&P 500 Historical Data