
| Symbol | Last | Change | % | High | Low |
|---|---|---|---|---|---|
| PLATINUM | 2,045.50 | -19.70 | -0.95% | 2,051.10 | 1,983.00 |
| Close | GMT Time : Mon Apr 13 2026 02:37 | ||||
Platinum : Intraday Live Chart
Platinum : Technical Signal Buy & Sell
| 5 Min Signal | 1 Hour Signal | 1 Day Signal |
|---|---|---|
| Buy | Sell | Sell |
Platinum : Moving Averages
| Period | MA 20 | MA 50 | MA 100 |
|---|---|---|---|
| 5 Minutes | 2039.27 | 2021.57 | 1983.55 |
| 1 Hour | 2048.58 | 2053.70 | 2060.38 |
| 1 Day | 1960.85 | 2073.50 | 2194.45 |
| 1 Week | 2054.51 | 1631.27 | 1309.54 |
Platinum : Technical Resistance Level
| Resistance 1 - R1 | Resistance 2 - R2 | Resistance 3 - r3 |
|---|---|---|
| 2,073.80 | 2,119.20 | 2,141.90 |
Platinum : Technical Support Level
| Support 1 - S1 | Support 2 - S2 | Support 3 - S3 |
|---|---|---|
| 2,005.70 | 1,983.00 | 1,937.60 |
Platinum : Periodical High, Low & Average
| Period | High Change from Last | Low Change from Last | Average Change from Last |
|---|---|---|---|
| 1 Week | 2,122.80 -77.30 | 1,966.70 +78.80 | 2,039.03 +6.47 |
| 1 Month | 2,122.80 -77.30 | 1,804.00 +241.50 | 1,960.57 +84.93 |
| 3 Month | 2,795.50 -750.00 | 1,804.00 +241.50 | 2,174.56 -129.06 |
| 6 Month | 2,795.50 -750.00 | 1,489.20 +556.30 | 1,976.04 +69.46 |
| 1 Year | 2,795.50 -750.00 | 947.80 +1,097.70 | 1,622.94 +422.56 |
Platinum : Historical Chart
Group by:
Related News


About Platinum 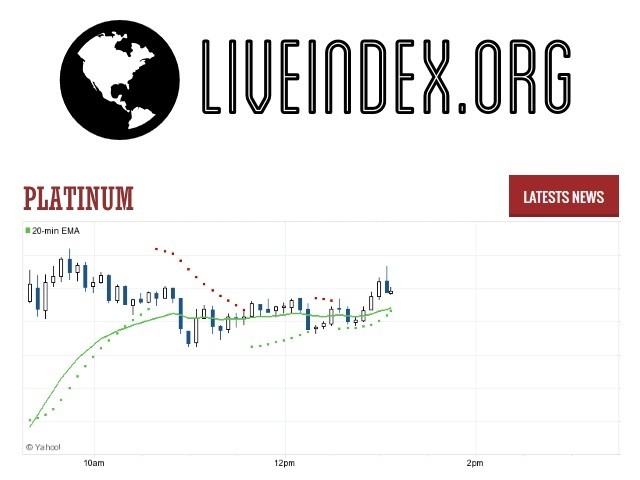
Platinum | Platinum Prices | Platinum Live Quotes | Platinum Prices in US Dollar | Platinum Live Quotes
Live Price of Platinum. Platinum Live Chart, Intraday & Historical Chart. Platinum Buy & Sell Signal and News & Videos, Platinum Averages, Returns & Historical Data
» Platinum
» Platinum Real Time Quotes
» Platinum Live Chart
» Platinum Intraday Chart
» Platinum Historical Chart
» Platinum Buy Sell Signal
» Platinum News
» Platinum Videos
» Platinum Averages
» Platinum Currency Pair
» Platinum Historical Data