Symbol | Last | Change | % | High | Low |
---|---|---|---|---|---|
IBEX 35 – SPAIN | 11,789.3 | -176.2 | -1.47% | 11,950.6 | 11,771.9 |
Close | Spain Time : Wed Dec 11 2024 22:53 |
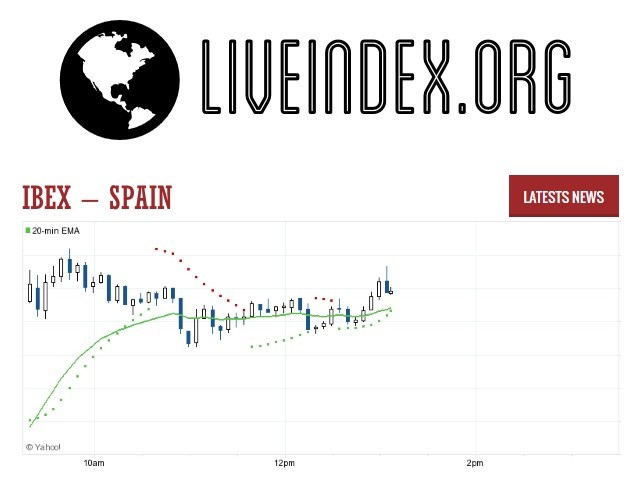
IBEX 35 : Intraday Live Chart
IBEX 35 : Technical Signal Buy & Sell
5 Min Signal | 1 Hour Signal | 1 Day Signal |
---|---|---|
Sell | Sell | Buy |
IBEX 35 : Moving Averages
Period | MA 20 | MA 50 | MA 100 |
---|---|---|---|
5 Minutes | 11794.15 | 11815.10 | 11824.90 |
1 Hour | 11906.23 | 11969.17 | 12022.98 |
1 Day | 11784.15 | 11731.69 | 11681.29 |
1 Week | 11471.94 | 10998.18 | 10179.06 |
IBEX 35 : Technical Resistance Level
Resistance 1 - R1 | Resistance 2 - R2 | Resistance 3 - r3 |
---|---|---|
12,014.0 | 12,038.2 | 12,070.4 |
IBEX 35 : Technical Support Level
Support 1 - S1 | Support 2 - S2 | Support 3 - S3 |
---|---|---|
11,957.6 | 11,925.4 | 11,901.2 |
IBEX 35 : Periodical High, Low & Average
Period | High Change from Last | Low Change from Last | Average Change from Last |
---|---|---|---|
1 Week | 12,153.6 -364.3 | 11,939.1 -149.8 | 12,052.0 -262.7 |
1 Month | 12,153.6 -364.3 | 11,295.0 +494.3 | 11,721.4 +67.9 |
3 Month | 12,153.6 -364.3 | 11,051.1 +738.2 | 11,733.0 +56.3 |
6 Month | 12,153.6 -364.3 | 10,298.7 +1,490.6 | 11,329.5 +459.8 |
1 Year | 12,153.6 -364.3 | 9,798.8 +1,990.5 | 10,933.2 +856.1 |
IBEX 35 : Historical Chart
The IBEX 35 is the benchmark stock market index of Madrid, Spain’s principal stock exchange. It is a market capitalization weighted index comprising the 35 most liquid Spanish stocks traded in the Madrid Stock Exchange General Index and is reviewed twice annually. Trading on options and futures contracts on the IBEX 35 is provided by MEFF.
The IBEX 35 was inaugurated on 14 January 1992,[4] although there are calculated values for the index back to 29 December 1989, where the base value of 3,000 points lies.
Between 2000 and 2007, the index outperformed many of its Western peers, driven by relatively strong domestic economic growth which particularly helped construction and real estate stocks. Consequently, while the record highs to date of the FTSE 100, CAC 40 and AEX, for example, were set during the dot-com bubble in 1999 and 2000, the IBEX 35’s all-time maximum of 15,945.70 was reached on 8 November 2007.
The week of the January 2008 stock market downturn was characterised by extreme volatility in the markets, and saw both the biggest one day percentage fall and rise in the IBEX 35’s history. The index closed 7.5% down on 21 January 2008, the second biggest fall in the Spanish equity market since 1987, and rose a record 6.95% three days later.
IBEX - IBEX 35 Index | IBEX 35 Live Quotes | EU Index
Live Price of IBEX. IBEX Live Chart, IBEX Intraday & Historical Live Chart. IBEX Buy Sell Signal, IBEX News, IBEX Videos, IBEX Averages, Returns & Historical Data
» IBEX
» IBEX Real Time Quotes
» IBEX Live Chart
» IBEX Intraday Chart
» IBEX Historical Chart
» IBEX Buy Sell Signal
» IBEX News
» IBEX Videos
» IBEX Averages
» IBEX Returns
» IBEX Historical Data