
| Symbol | Last | Change | % | High | Low |
|---|---|---|---|---|---|
| GOLD | 4,492.00 | -113.70 | -2.47% | 4,738.20 | 4,478.40 |
| Close | GMT Time : Mon Mar 23 2026 09:25 | ||||
Gold : Intraday Live Chart
Gold : Technical Signal Buy & Sell
| 5 Min Signal | 1 Hour Signal | 1 Day Signal |
|---|---|---|
| Neutral | Sell | Buy |
Gold : Moving Averages
| Period | MA 20 | MA 50 | MA 100 |
|---|---|---|---|
| 5 Minutes | 4492.00 | 4492.00 | 4492.00 |
| 1 Hour | 4714.25 | 4931.08 | 5056.33 |
| 1 Day | 5136.42 | 5072.52 | 4773.52 |
| 1 Week | 4564.86 | 3924.81 | 3267.65 |
Gold : Technical Resistance Level
| Resistance 1 - R1 | Resistance 2 - R2 | Resistance 3 - r3 |
|---|---|---|
| 4,768.60 | 4,913.70 | 5,028.40 |
Gold : Technical Support Level
| Support 1 - S1 | Support 2 - S2 | Support 3 - S3 |
|---|---|---|
| 4,508.80 | 4,394.10 | 4,249.00 |
Gold : Periodical High, Low & Average
| Period | High Change from Last | Low Change from Last | Average Change from Last |
|---|---|---|---|
| 1 Week | 5,011.20 -519.20 | 4,478.40 +13.60 | 4,777.23 -285.23 |
| 1 Month | 5,409.70 -917.70 | 4,478.40 +13.60 | 5,136.42 -644.42 |
| 3 Month | 5,584.30 -1,092.30 | 4,291.80 +200.20 | 4,872.17 -380.17 |
| 6 Month | 5,584.30 -1,092.30 | 3,764.00 +728.00 | 4,475.95 +16.05 |
| 1 Year | 5,584.30 -1,092.30 | 2,983.30 +1,508.70 | 3,904.23 +587.77 |
Gold : Historical Chart
Group by:
Related News


About Gold 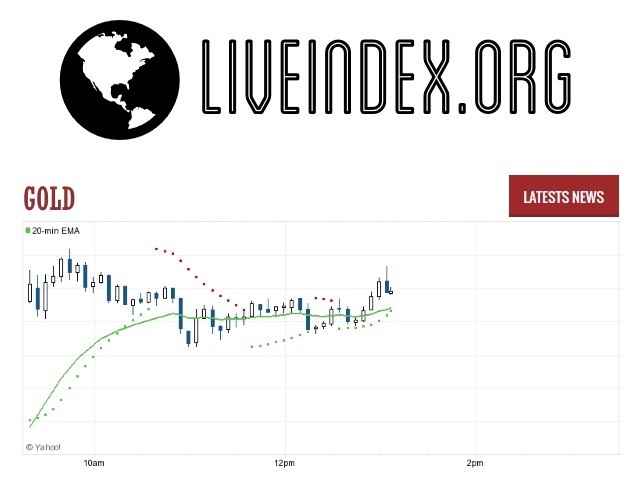
Gold | Gold Prices | Gold Live Quotes | Gold Prices in US Dollar | Gold Live Quotes
Live Price of Gold. Gold Live Chart, Intraday & Historical Chart. Gold Buy & Sell Signal and News & Videos, Gold Averages, Returns & Historical Data
» Gold
» Gold Real Time Quotes
» Gold Live Chart
» Gold Intraday Chart
» Gold Historical Chart
» Gold Buy Sell Signal
» Gold News
» Gold Videos
» Gold Averages
» Gold Currency Pair
» Gold Historical Data