
| Symbol | Last | Change | % | High | Low |
|---|---|---|---|---|---|
| GBP / JPY | 214.08 | -0.29 | -0.14% | 214.63 | 213.66 |
| Open Last Trade : 05:30 | GMT Time : Mon Apr 13 2026 05:30 | ||||
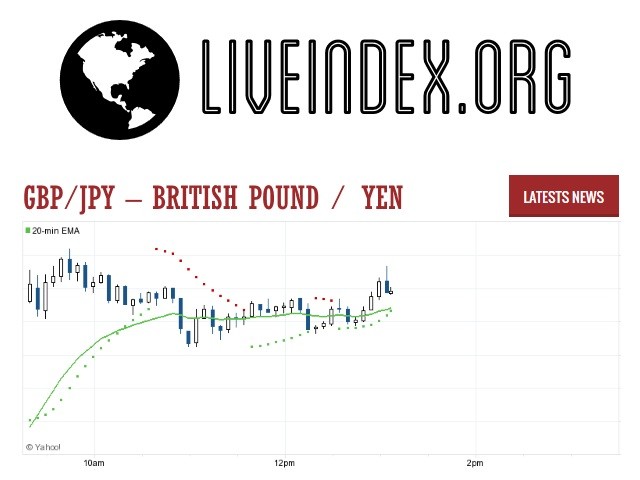
GBP/JPY : Intraday Live Chart
GBP/JPY : Technical Signal Buy & Sell
| 5 Min Signal | 1 Hour Signal | 1 Day Signal |
|---|---|---|
| Buy | Sell | Buy |
GBP/JPY : Moving Averages
| Period | MA 20 | MA 50 | MA 100 |
|---|---|---|---|
| 5 Minutes | 214.05 | 214.03 | 213.97 |
| 1 Hour | 214.16 | 214.28 | 213.96 |
| 1 Day | 212.16 | 210.85 | 211.38 |
| 1 Week | 209.87 | 202.64 | 198.08 |
GBP/JPY : Technical Resistance Level
| Resistance 1 - R1 | Resistance 2 - R2 | Resistance 3 - r3 |
|---|---|---|
| 214.91 | 215.53 | 215.88 |
GBP/JPY : Technical Support Level
| Support 1 - S1 | Support 2 - S2 | Support 3 - S3 |
|---|---|---|
| 213.94 | 213.59 | 212.97 |
GBP/JPY : Periodical High, Low & Average
| Period | High Change from Last | Low Change from Last | Average Change from Last |
|---|---|---|---|
| 1 Week | 214.63 -0.55 | 0.00 +214.08 | 213.23 +0.85 |
| 1 Month | 214.63 -0.55 | 0.00 +214.08 | 212.16 +1.92 |
| 3 Month | 214.63 -0.55 | 0.00 +214.08 | 211.43 +2.65 |
| 6 Month | 214.63 -0.55 | 0.00 +214.08 | 208.67 +5.41 |
| 1 Year | 214.63 -0.55 | 0.00 +214.08 | 202.47 +11.61 |
GBP/JPY : Historical Chart
Related News


GBP to JPY Exchange Rate History: Volatility Across Monetary Regimes
The GBP to JPY exchange rate stands out as one of the most volatile major currency pairs, reflecting the contrasting monetary policies of the Bank of England (BoE) and the Bank of Japan (BoJ). The Japanese Yen (JPY) has long been associated with ultra-loose monetary policy and deflationary pressure, while the British Pound (GBP) has experienced episodes of strength, crisis, and recovery. The pair’s historical performance provides insight into risk sentiment, rate differentials, and global macroeconomic trends.
1991–2000: JPY Strength and GBP Recovery
The early 1990s saw the Japanese Yen appreciate significantly, driven by Japan’s economic might and a strong trade surplus.
In contrast, the UK faced a recession and currency instability, culminating in its exit from the ERM in 1992.
GBP/JPY fell sharply in the early ’90s, reaching lows near 130.
As the decade progressed:
The UK economy recovered and GBP gained strength.
Meanwhile, Japan entered a deflationary spiral, leading to monetary easing.
By 2000:
GBP/JPY rebounded, hovering near 150, aided by diverging central bank policies.
2001–2008: BoE Rate Hikes vs BoJ Deflation
The early 2000s marked a phase of yen weakness and pound strength:
The Bank of Japan maintained near-zero interest rates and engaged in early quantitative easing.
The UK economy grew steadily, with the BoE hiking rates gradually.
GBP/JPY rose steadily:
Peaking near 250 in 2007, a multi-decade high, fueled by the carry trade as investors borrowed in yen to invest in higher-yielding GBP assets.
This trend reversed violently during the 2008 global financial crisis.
2009–2013: Financial Crisis and Yen Safe-Haven Status
The post-crisis era saw the yen surge as a safe-haven currency, while the pound declined amid UK recession and central bank easing:
GBP/JPY plunged from 250 to below 130 by 2009.
Despite UK recovery efforts, the pair struggled to gain traction.
The yen remained strong due to:
Japan’s current account surplus.
Continued global risk aversion.
GBP/JPY traded in a wide 120–150 range, reflecting both monetary divergence and global uncertainty.
2014–2019: Abenomics vs Brexit
This period marked two defining developments:
Japan launched Abenomics, combining fiscal stimulus, massive QE, and negative interest rates.
The UK held the Brexit referendum in 2016, leading to significant GBP weakness.
From 2014 to early 2016:
GBP/JPY rebounded above 190, driven by yen weakness.
Post-Brexit:
GBP collapsed, and the pair fell to near 130 again, mirroring 2009 crisis levels.
Despite Japan’s aggressive monetary easing, the yen retained some strength during global risk-off events.
2020–2024: Pandemic Recovery and Rate Divergence
The COVID-19 pandemic ushered in synchronized global easing:
Both the BoE and BoJ slashed rates and expanded QE.
However, from 2022 onward, the BoE began hiking rates aggressively to curb inflation.
In contrast:
The BoJ maintained ultra-loose policy, defending its yield curve control (YCC) framework.
This divergence led to a sharp GBP/JPY rally:
By late 2023 and into 2024, GBP/JPY approached 185–190, retracing its pre-Brexit highs.
Yen weakness intensified as the BoJ stayed behind the global rate hike curve.
✅ Key
🟢 = GBP appreciated vs JPY
❌ = GBP depreciated vs JPY
⚠️ = Sideways / neutral trend
📊 GBP to JPY Exchange Rate by Decade
| Decade | Avg. GBP/JPY Rate (Approx) | Change vs. Previous Decade | Key Drivers |
|---|---|---|---|
| 1991–2000 | 130 – 150 | ⚠️ Mixed trend | ERM crisis, JPY strength, UK recovery |
| 2001–2008 | 180 – 250 | 🟢 GBP appreciated | BoE hikes, BoJ easing, carry trade |
| 2009–2013 | 125 – 150 | ❌ GBP weakened | Post-crisis pound slump, yen safe-haven flows |
| 2014–2019 | 130 – 190 | ⚠️ Volatile | Abenomics vs Brexit shocks |
| 2020–2024 | 150 – 190 | 🟢 GBP appreciated | Rate divergence, BoE hikes vs BoJ ultra-loose stance |
The GBP to JPY exchange rate has swung between extremes due to the contrasting fundamentals of the two economies. With Japan still lagging in policy normalization and the UK showing signs of stabilization, the pair may continue its upward bias. However, any policy shift from the BoJ, especially regarding YCC or rate hikes, could lead to swift reversals. Traders and economists alike watch this pair for clues into global risk appetite, rate differentials, and central bank credibility.
GBP/JPY - British Pound / Japanese Yen Currency Rate
Live Price of GBP/JPY. GBP/JPY Live Chart, Intraday & Historical Live Chart, Buy Sell Signal, GBP/JPY News, GBP/JPY Averages, Returns & Historical Data
» GBP/JPY
» GBP/JPY Real Time Quotes
» GBP/JPY Live Chart
» GBP/JPY Intraday Chart
» GBP/JPY Historical Chart
» GBP/JPY Buy Sell Signal
» GBP/JPY News
» GBP/JPY Videos
» GBP/JPY Averages
» GBP/JPY Currency Pair
» GBP/JPY Historical Data