| Symbol | Last | Change | % | High | Low |
|---|---|---|---|---|---|
| EUR / GBP | 0.8709 | -0.0007 | -0.08% | 0.8723 | 0.8672 |
| Open Last Trade : 18:59 | GMT Time : Wed Feb 11 2026 18:59 | ||||
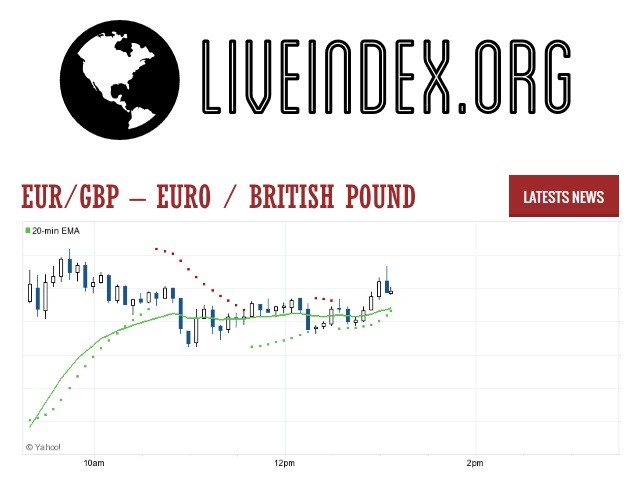
EUR/GBP : Intraday Live Chart
EUR/GBP : Technical Signal Buy & Sell
| 5 Min Signal | 1 Hour Signal | 1 Day Signal |
|---|---|---|
| Buy | Buy | Sell |
EUR/GBP : Moving Averages
| Period | MA 20 | MA 50 | MA 100 |
|---|---|---|---|
| 5 Minutes | 0.87 | 0.87 | 0.87 |
| 1 Hour | 0.87 | 0.87 | 0.87 |
| 1 Day | 0.87 | 0.87 | 0.87 |
| 1 Week | 0.87 | 0.86 | 0.85 |
EUR/GBP : Technical Resistance Level
| Resistance 1 - R1 | Resistance 2 - R2 | Resistance 3 - r3 |
|---|---|---|
| 0.8719 | 0.8720 | 0.8724 |
EUR/GBP : Technical Support Level
| Support 1 - S1 | Support 2 - S2 | Support 3 - S3 |
|---|---|---|
| 0.8714 | 0.8710 | 0.8709 |
EUR/GBP : Periodical High, Low & Average
| Period | High Change from Last | Low Change from Last | Average Change from Last |
|---|---|---|---|
| 1 Week | 0.8721 -0.0012 | 0.0000 +0.8709 | 0.8695 +0.0014 |
| 1 Month | 0.8725 -0.0016 | 0.0000 +0.8709 | 0.8674 +0.0035 |
| 3 Month | 0.8848 -0.0139 | 0.0000 +0.8709 | 0.8725 -0.0016 |
| 6 Month | 0.8848 -0.0139 | 0.0000 +0.8709 | 0.8711 -0.0002 |
| 1 Year | 0.8848 -0.0139 | 0.0000 +0.8709 | 0.8615 +0.0094 |
EUR/GBP : Historical Chart
EUR to GBP Exchange Rate History: Brexit, Euro Integration, and Monetary Divergence
The EUR to GBP exchange rate is one of Europe’s most politically sensitive and economically significant currency pairs. It reflects the evolving relationship between the Eurozone and the United Kingdom, tracking changes in monetary policy, trade alignment, interest rate differentials, and geopolitical events like Brexit.
From the euro’s inception in 1999 to the UK’s departure from the European Union, the EUR/GBP pair has experienced major transformations. As of 2025, it remains a key focus for forex traders, central banks, businesses, and policy analysts monitoring intra-European capital flows and trade.
Pre-Euro Foundations: GBP vs. National European Currencies
Prior to the euro’s introduction, the British pound sterling (GBP) traded against individual European currencies such as the Deutsche Mark, French Franc, and Italian Lira. The UK chose not to join the European Monetary Union (EMU), retaining its monetary sovereignty.
The ERM (Exchange Rate Mechanism) of the 1980s and early 1990s sought to stabilize European currencies, including a GBP/DEM rate band. However, on Black Wednesday (September 16, 1992), the UK exited the ERM after being unable to maintain the pound’s parity. This crisis triggered a sharp devaluation of the GBP and laid the foundation for a floating currency regime.
Throughout the 1990s, while the euro was still a concept, the pound fluctuated significantly against European currencies, with the Deutsche Mark (DEM) being the most watched comparator. The euro’s formation in 1999 would change that forever.
1999–2009: Euro Launch and GBP Independence
The euro was officially launched as an electronic currency in January 1999 and became a physical currency in 2002. The UK did not adopt the euro, opting to retain the pound due to domestic political opposition and concerns over sovereignty.
The EUR/GBP exchange rate started around 0.66, meaning 1 euro was worth 66 pence. In the early 2000s, the euro depreciated amid concerns about the stability of the Eurozone. By 2000, the pair had dropped to 0.58, the lowest in the euro’s history against the pound.
However, the trend reversed in the mid-2000s. As UK growth slowed and the euro strengthened due to low inflation and expanding membership, the EUR/GBP rate climbed. By 2008, amid the global financial crisis, the euro surged, touching 0.97, nearly reaching parity with sterling.
This decade reflected a monetary divergence, where the ECB adopted a unified but cautious policy while the Bank of England (BoE) shifted between tightening and easing based on UK-specific conditions.
2010–2019: Post-Crisis Recovery and the Brexit Shock
The 2010s were dominated by two macroeconomic narratives: the Eurozone debt crisis and the UK’s decision to leave the European Union (Brexit).
After the 2008 crash, both the ECB and BoE adopted quantitative easing and near-zero interest rates. However, the Eurozone debt crisis (2010–2013) created new uncertainty. Greece, Ireland, Portugal, and Spain experienced debt downgrades, bailouts, and austerity measures, weakening the euro.
From 2010 to 2015, the EUR/GBP exchange rate ranged from 0.75 to 0.85, with periods of pound strength as the UK economy recovered faster than the Eurozone.
The real turning point came in 2016, when the UK voted to leave the EU. On June 24, 2016, the pound plunged nearly 10% in a single day. The EUR/GBP pair spiked to 0.86, then reached 0.93 by August 2017 as Brexit negotiations dragged on and market uncertainty grew.
Despite occasional rebounds, the pound remained pressured due to lack of trade clarity, capital flight, and the potential re-introduction of trade barriers. By 2019, EUR/GBP was hovering between 0.87 and 0.91, reflecting persistent Brexit headwinds.
2020s: Brexit Finalized, Pandemic, and Rate Divergence
The 2020s began with two seismic events: Brexit’s formal implementation in January 2020 and the global COVID-19 pandemic. These events had contradictory impacts on the EUR/GBP pair.
Initially, the UK suffered greater economic contraction, causing the rate to hit 0.93 in March 2020. However, the UK’s early vaccination success, centralized monetary policy, and resilient service exports helped the pound recover. By mid-2021, EUR/GBP had fallen back to 0.85.
From 2022 onwards, the divergence between ECB and BoE policies became pronounced. As inflation surged globally, the Bank of England raised interest rates aggressively, while the European Central Bank was slower to act, especially in the face of energy shocks due to the Russia-Ukraine war.
This policy divergence pushed the EUR/GBP rate lower, reaching 0.84 in 2023 and remaining range-bound through 2024. As of April 2025, the exchange rate trades around 0.86, showing modest euro strength as the ECB catches up on rate hikes.
EUR to GBP Exchange Rate by Decade
| Decade | Avg. EUR/GBP Rate (Approx) | Change vs. Previous Decade | Key Events |
|---|---|---|---|
| 1990s (pre-euro) | 0.58–0.66 (estimated) | ❔ N/A | Pre-Euro trading; Black Wednesday |
| 2000s | 0.66 → 0.97 | ❌ -47% depreciation of GBP | Euro launch; Financial Crisis |
| 2010s | 0.75 → 0.93 | ❌ -24% depreciation | Brexit vote; Eurozone debt crisis |
| 2020s (till 2025) | 0.93 → 0.86 | 🟢 +7.5% GBP appreciation | Brexit implementation; BoE rate hikes |
✅ Key:
🟢 = GBP appreciated vs EUR
❌ = GBP depreciated vs EUR
❔ = Not directly comparable (pre-euro era)
EUR/GBP - US Dollar / Japanese Yen Currency Rate

Live Price of EUR/GBP. EUR/GBP Live Chart, Intraday & Historical Live Chart, Buy Sell Signal, EUR/GBP News, EUR/GBP Averages, Returns & Historical Data
» EUR/GBP
» EUR/GBP Real Time Quotes
» EUR/GBP Live Chart
» EUR/GBP Intraday Chart
» EUR/GBP Historical Chart
» EUR/GBP Buy Sell Signal
» EUR/GBP News
» EUR/GBP Videos
» EUR/GBP Averages
» EUR/GBP Currency Pair
» EUR/GBP Historical Data


