
| Symbol | Last | Change | % | High | Low |
|---|---|---|---|---|---|
| AUD / USD | 0.6652 | -0.0010 | -0.15% | 0.0000 | 0.0000 |
| Close | GMT Time : Sat Dec 13 2025 04:11 | ||||
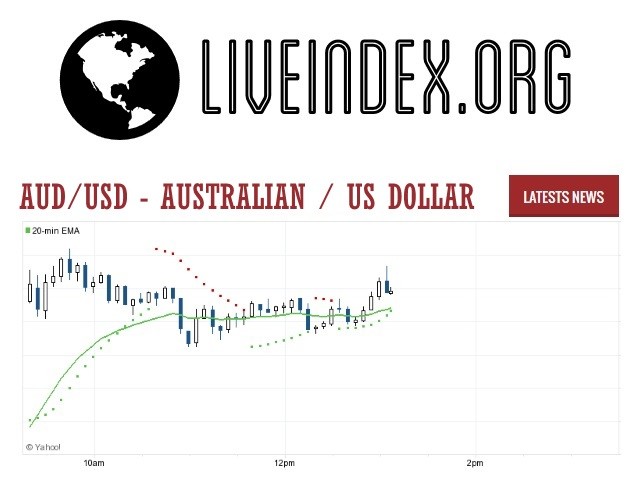
AUD/USD : Intraday Live Chart
AUD/USD : Technical Signal Buy & Sell
| 5 Min Signal | 1 Hour Signal | 1 Day Signal |
|---|---|---|
| Sell | Sell | Buy |
AUD/USD : Moving Averages
| Period | MA 20 | MA 50 | MA 100 |
|---|---|---|---|
| 5 Minutes | 0.67 | 0.67 | 0.67 |
| 1 Hour | 0.67 | 0.67 | 0.66 |
| 1 Day | 0.66 | 0.65 | 0.66 |
| 1 Week | 0.65 | 0.64 | 0.65 |
AUD/USD : Technical Resistance Level
| Resistance 1 - R1 | Resistance 2 - R2 | Resistance 3 - r3 |
|---|---|---|
| 0.0000 | 0.0000 | 0.0000 |
AUD/USD : Technical Support Level
| Support 1 - S1 | Support 2 - S2 | Support 3 - S3 |
|---|---|---|
| 0.0000 | 0.0000 | 0.0000 |
AUD/USD : Periodical High, Low & Average
| Period | High Change from Last | Low Change from Last | Average Change from Last |
|---|---|---|---|
| 1 Week | 0.6677 -0.0025 | 0.0000 +0.6652 | 0.6646 +0.0006 |
| 1 Month | 0.6677 -0.0025 | 0.0000 +0.6652 | 0.6551 +0.0101 |
| 3 Month | 0.6688 -0.0036 | 0.0000 +0.6652 | 0.6551 +0.0101 |
| 6 Month | 0.6688 -0.0036 | 0.0000 +0.6652 | 0.6537 +0.0115 |
| 1 Year | 0.6688 -0.0036 | 0.0000 +0.6652 | 0.6447 +0.0205 |
AUD/USD : Historical Chart
Related News


AUD to USD Exchange Rate History: Mining Boom Meets Dollar Dominance
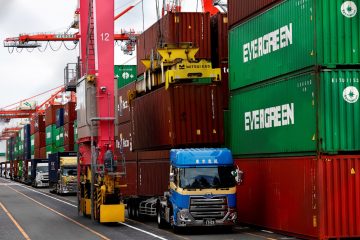
The AUD to USD exchange rate is one of the most actively traded currency pairs globally, representing the relationship between Australia’s commodity-dependent economy and the United States’ global financial supremacy. Often seen as a barometer for global risk sentiment and Chinese growth, this pair has experienced wide swings, reflecting everything from interest rate differentials to geopolitical uncertainty and commodity cycles.
1990s: From Pegs to a Free Float
The Australian dollar was floated in 1983, and by the 1990s it had become a free-floating currency sensitive to global trade and mining.
The AUD/USD ranged between 0.50 to 0.80.
The US dollar strengthened through much of the decade due to the dot-com boom.
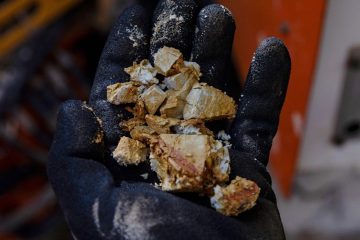
Australia’s reliance on mining exports created downside risks during periods of low commodity prices.
The pair traded relatively low, bottoming near 0.50 during the Asian Financial Crisis (1997–1998).
2000–2008: China’s Rise, Australia’s Golden Era
This period marked the Chinese infrastructure super-cycle, which turbocharged demand for Australian commodities.
AUD/USD rallied from ~0.50 in 2001 to ~0.97 by 2008.
Australia raised interest rates steadily, attracting capital inflows.
The US dollar, hit by growing deficits and the early signs of a housing bubble, weakened.
The carry trade also supported the Aussie, making it a high-yield play against the low-interest USD.
2008–2013: Post-Crisis Peak
Despite the 2008 crash, Australia’s resilience and China’s stimulus created a second AUD surge.
AUD/USD dropped to ~0.60 in late 2008 but rebounded quickly.
By July 2011, the Aussie hit parity (1.10) — its highest level since the float.
The Fed’s quantitative easing contrasted sharply with Australia’s tighter policy stance.
This era solidified AUD’s role as a risk-on currency — rallying during global optimism, falling in times of fear.
2014–2019: A Downward Drift
The post-mining boom era hit Australia hard:
AUD/USD gradually declined to ~0.68–0.70.
The RBA began cutting interest rates, while the Fed tightened (2016–2018).
Declining iron ore prices and slower Chinese growth weakened AUD demand.
Meanwhile, the USD gained strength as US economic data improved, especially under tax reform optimism in 2017–2018.
2020–2024: Pandemic Shocks and Recovery Cycles
During the COVID-19 crisis:
AUD/USD fell to 0.57 in March 2020, its lowest in almost two decades.
Massive stimulus in both nations weakened both currencies.
As global recovery began, AUD surged back to ~0.78 in early 2021.
However, from 2022 onward:
The Fed hiked rates aggressively to fight inflation.
The RBA lagged behind, and China’s slower recovery dragged AUD down.
AUD/USD settled near 0.65 by 2024, showing relative USD strength.
As of April 2025, AUD/USD trades around 0.66, showing modest strength in the Aussie as commodity prices firm up and US rate hikes plateau. But uncertainties over China’s demand, US fiscal deficits, and global risk appetite keep the pair range-bound.
✅ Key
🟢 = AUD appreciated vs USD
❌ = AUD depreciated vs USD
⚠️ = Mixed / Sideways trend
📊 AUD to USD Exchange Rate by Decade
| Decade | Avg. AUD/USD Rate (Approx) | Change vs. Previous Decade | Key Events |
|---|---|---|---|
| 1990s | 0.50 – 0.80 | ⚠️ Volatile range | Asian Financial Crisis, USD strength |
| 2000s | 0.50 → 0.97 | 🟢 Major AUD rally | China boom, AUD interest rate premium |
| 2010s | 0.95 → 0.68 | ❌ AUD downtrend | Commodity correction, US recovery |
| 2020s (till 2025) | 0.57 → 0.66 | ⚠️ Rebound then decline | Pandemic, Fed tightening, China uncertainty |
The AUD to USD pair remains highly sensitive to risk sentiment, China’s economic trajectory, and interest rate policy divergence between the Fed and the RBA. Traders closely monitor this pair as a proxy for global growth and commodity demand.
AUD/USD - Australian Dollar / US Dollar Currency Rate
Live Price of AUD/USD. AUD/USD Live Chart, Intraday & Historical Live Chart, Buy Sell Signal, AUD/USD News, AUD/USD Averages, Returns & Historical Data
» AUD/USD
» AUD/USD Real Time Quotes
» AUD/USD Live Chart
» AUD/USD Intraday Chart
» AUD/USD Historical Chart
» AUD/USD Buy Sell Signal
» AUD/USD News
» AUD/USD Videos
» AUD/USD Averages
» AUD/USD Currency Pair
» AUD/USD Historical Data