Global Markets Shed $5.2 Trillion During the Dow’s Stock Market Correction

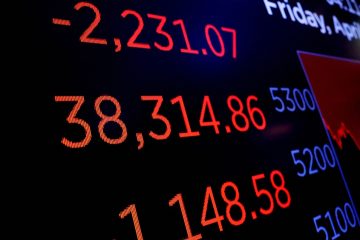
Major stock market indices may be back up Friday, but the recent correction didn’t come without its pain.
Between the market’s record high on Jan. 26 and when the Dow Jones Industrial Average and S&P 500 entered correction territory Thursday, global markets (as measured by the S&P Global BMI index) shed $ 5.2 trillion. That’s according to data from S&P Dow Jones Indices’ Howard Silverblatt. That amount exceeds the gross domestic production of the U.K. and Canada combined. In 2016, Canada’s GDP clocked in at $ 1.5 trillion, while the U.K.’s came in at $ 2.7 trillion.
In the same period, the S&P 500 shed some $ 2.5 trillion.
That comes with the stock market entering correction territory, a fall of at least 10% since record highs. As global economies recover, investors have grown increasingly worried about central banks around the world raising interest rates—a move that would make stocks a less attractive investment.
On Thursday, for instance, Bank of England Gov. Mark Carney said British regulators may have to ease off of the economic stimulus faster than expected. “It will likely be necessary to raise interest rates somewhat earlier and to a somewhat greater extent than we had thought,” he said.
Still, some remain unperturbed by the recent stock market rout, noting that investors are simply rebalancing their portfolios as markets grow more choppy.
“You’ve had a change in the environment. People were positioned for low volatility, low interest rates, and low inflation,” said Brent Schutte, chief investment strategist at Northwestern Mutual Wealth Management. “Now you have people moving portfolios around. I don’t think one or two days of selling is going to clean house. I think we have a few more days to go.”
And still, investors who made their bets in 2017 on the stock market are still in the green. Since three months earlier, the S&P Global BMI has added $ 9.5 trillion, while the S&P 500 has added $ 3.6 trillion.
On Friday, major stock market indexes also bounced back ever so slightly. The Dow Jones Industrial Average rose 1.4% to 24,190, while the S&P 500 rose 1.5% to 2,619. Notably, both are still down since the start of 2018.
It’s important to note that corrections don’t necessarily point to long-term losses.
“Prior to the most recent example, we have experienced 36 corrections since 1980, and the S&P 500 fell by an average of 15.6% from peak to trough during these periods,” LPL Research noted in a Friday paper. “Twelve months later, the index made up some ground, rising an average of 16% from the low, and after 24 months, the S&P 500 had climbed by an average of 28%, reinforcing the need for long-term investors to maintain their diversified strategies.”

