Stocks Gearing Up for a Major Move
The major U.S. stock indices finished slightly lower last week, as fears of a Brexit (the U.K. leaving the European Union) put pressure on the market.
The Nasdaq 100 led the way down, losing 1.9%, and the benchmark S&P 500 finished the week almost exactly at the same level it did on April 1, as the index continued to negotiate major overhead resistance at 2,104 to 2,135. A sustained move above this resistance area is necessary to clear the way for the next multimonth advance in the broader market. Until it clears resistance, stocks remain vulnerable to a pullback.
Last week’s decline was modest but broad based, as nearly every sector of the S&P 500 finished lower, led by financial services (-3%). Brexit fears have nervous investors flocking to the relative safety of U.S. Treasuries, driving long-term interest rates lower, which dampens profitability in the financial sector. Real estate was the only sector to eke out a small gain.
Investor Fear Warns of More Market Weakness
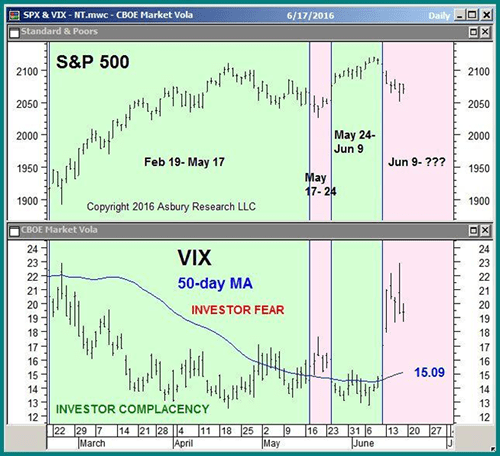
In last week’s report, I pointed out that the Volatility S&P 500 (VIX) jumped above its 50-day moving average on June 10 after months of hovering near a complacent extreme around 12. I said that as long as the VIX remained above its 50-day, it would be vulnerable to more weakness.
And that was exactly what happened as the VIX stayed above this moving average, currently at 15.09, all week long and finished Friday’s session at 19.41.
I am waiting for a move back below 15.09 to indicate investors have again become complacent enough to fuel the next market rally, like we saw between Feb. 19 and May 17. Until then, it’s wise to remain on the defensive.
Editor’s note: Being on the defensive doesn’t have to mean holding cash. In the past few months, Profitable Trading’s options expert, Jared Levy, has made three quick downside bets on the market that achieved extraordinary returns:
— 62.4% in nine days (2,531.8% annualized)
— 18.5% in one day (6,759.3% annualized)
— 38.2% in six days (2,321.3% annualized)
If you’re interested in trading alongside him, we’re offering access to his trades for just $ 49 a month. But you need to act fast. This special rate will be reserved for 15 minutes when you click here.
Investor Indecision Acts as Price Springboard
While the S&P 500 has been negotiating major overhead resistance at 2,104 to 2,135, the bellwether Dow Jones Industrial Average has been testing a corresponding major resistance level at 18,137 to 18,351, which represents the July, June and May 2015 highs.
The sideways action (read: investor indecision) that has ensued since the initial April test of this resistance has evolved into a triangular pattern, which is bordered by 17,489 and 17,981. A sustained move through either of these levels is likely to signal the direction of the Dow’s next near- to intermediate-term trend.
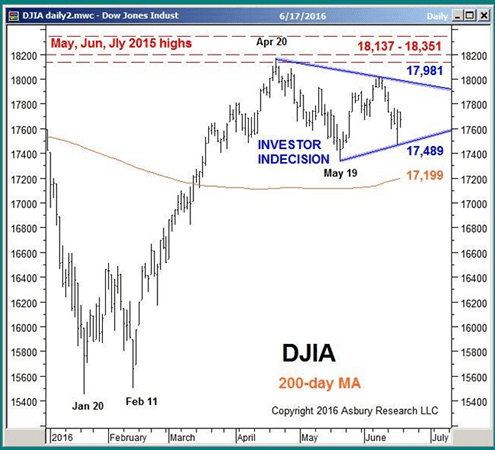
As long as the VIX remains above 15.09 this week, the Dow is more likely to break down below the lower boundary of the pattern at 17,489, which would target a decline to at least 16,570.
A move to 16,570 would decisively break the 200-day moving average, a widely watched major trend proxy, currently situated at 17,199. This would suggest a major bearish trend change is under way and portend even more weakness.
Conversely, a sustained rise above the upper boundary of the pattern at 17,981 would confirm a bullish breakout. This would target a rise to at least 18,720, decisively breaking major overhead resistance at 18,137 to 18,351 and clearing the way for the stock market’s next multimonth move higher.
Explaining U.S. Interest Rates’ Erratic Movement
Over the past five weeks, the yield of the benchmark 10-year Treasury note collapsed to 1.71% (on a closing basis), spiked back to 1.87%, and then fell as low as 1.57%. The next chart highlights the events that triggered this erratic behavior.
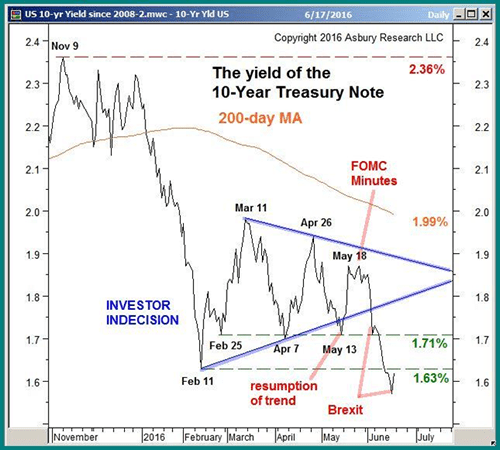
On May 13, yields declined below a three-month pattern of investor indecision, indicating the larger November trend of declining rates had resumed. However, they fell almost immediately back into the indecision area on the hawkish tone of the minutes of the April FOMC meeting. A week later, Brexit fears drove yields back down to fresh lows.
What does all of this mean for the future direction of interest rates?
In my view, the move back into the indecision area in mid-May indicated that investors decided long-term U.S. interest rates were bottoming. Once the Brexit issue gets resolved this week, this bottom in rates is likely to show itself again on the chart.
In the meantime, the key areas of support to watch are 1.58% (the November 2012 closing low) and 1.43% (the July 2012 closing low).
Smart Money Betting Gold is Overvalued
Gold prices rose to a new recovery high last week of $ 1,319 an ounce after essentially drifting sideways since March. This raises the question, “Is it time to get back into the gold market?”
The smart money suggests it is not.
The next chart plots gold futures along with the weekly net position of commercial hedgers, either long or short, according to the Commodity Futures Trading Commission’s Commitments of Traders (COT) report.
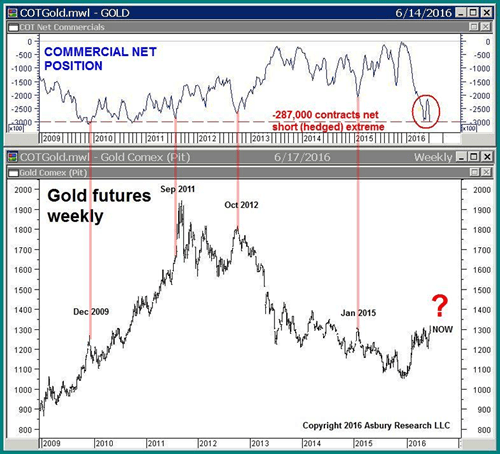
These market insiders, who use the futures market to hedge their physical gold holdings, currently have a net short position of more than 287,000 contracts. This represents an aggressive bet by the smart money that gold is currently overvalued. Similar extremes have closely coincided with some of the most important peaks in gold prices since 2009. So, new long positions based on last week’s move to fresh highs are a risky proposition.
No matter how tempting betting on a move to new highs may be, I would avoid going against the smart money here and wait for a move back to more normal hedging levels before chasing this rally.
Putting It All Together
The Dow industrials have been bumping into major overhead resistance at 18,137 to 18,351 for two months. This price action has formed a triangle pattern, and how that pattern gets resolved is likely to either fuel a sustainable move to new all-time highs or potentially trigger a correction.
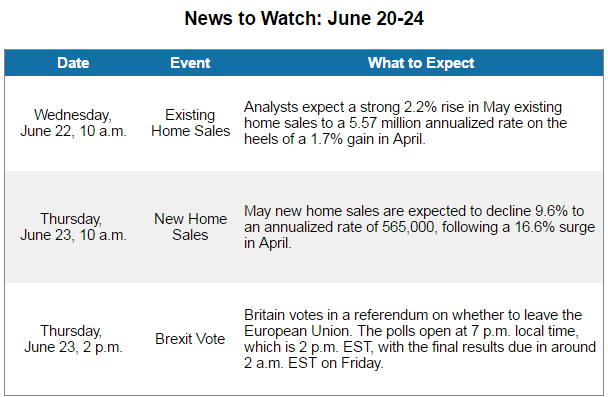
Elevated levels in the VIX tilt the directional bias in the bears’ favor, but the key will be the Brexit vote at the end of this week. If the U.K. leaves the European Union, stocks could plummet, at least initially. But if the country stays, it could be enough to push stocks to new all-time highs.