Caution: Watch Out for a Bearish Reversal

The major U.S. stock indices closed in the green last week. The advance was led by the small-cap Russell 2000 and tech-heavy Nasdaq 100, which gained 3.5% and 2.9%, respectively, posting their best weekly closes since late December.
This is a good sign, but keep in mind that these market leaders are still in negative territory for the year, underperforming the benchmark S&P 500. This suggests stocks have some work to do before the all-clear can be sounded.
All sectors of the S&P 500 finished in positive territory last week except for energy, which fell 1.3%. Technology and consumer staples led, both gaining 2.5%.
The table below displays Asbury Research’s ETF asset flows-based metric. It shows that the biggest outflows of investor assets over the past week came from energy, while the biggest inflows over the past one-week and one-month periods went into technology.

As long as investor assets keep flowing into technology, I expect the sector to continue to outperform.
Defense Still Makes Sense
The strength in technology resulted in the Nasdaq 100 closing above resistance at 4,415 to 4,486. While this clears the way for more near-term strength, the title of last week’s Market Outlook, “Time to Put a Defensive Plan in Place,” still applies due to a growing number of technical warning signs. These include extreme levels of investor complacency and weakness in oil prices, both of which I covered in detail last week.
Another potentially negative market influence in the weeks ahead is seasonality, which is simply a statistical representation of how the price of an asset historically moved over a particular period of time.
The chart below plots the weekly seasonal pattern in the S&P 500 during the second quarter based on data since 1957.
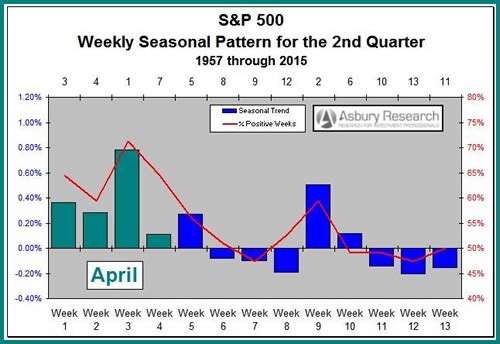
We see that, historically, the third full week of April — which is April 18-22 this year — is the strongest of the entire quarter. Since April is the seasonally strongest month of the year in the S&P 500, this effectively makes the third week of April the strongest week of the year.
After that, though, the index has mostly struggled until the second to last week of June, which is the weakest of the quarter.
Where Will the Rally Stall?
Now that I have pointed out several reasons for investors to be on the defensive, the next step is to try to identify where a bearish reversal will take place.
The S&P 500 closed last week at 2,073, just 9 points below its next overhead resistance level at 2,082, which represents the Dec. 29 high.
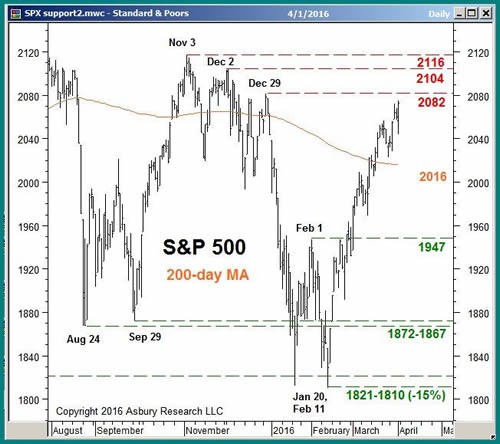
Additionally, the next resistance at the 2,104 Dec. 3 high sits just 1.5% above Friday’s close, while resistance from the Nov. 3 high at 2,116 is just over 2% away.
Considering the negative factors outlined above, the band of resistance between 2,082 and 2,116 is unlikely to be appreciably broken without at least a multiweek corrective decline first.
Declining Yields Show Apprehensive Bond Market
In the March 14 Market Outlook, I pointed out that the yield of the 10-year Treasury note was testing overhead resistance at 2%, saying this was an important inflection point from which we’d either see a move up to 2.15% or a decline back to 1.85%.
Below we can see that these yields basically stopped on a dime at 2%, closing as high as 1.98% on March 11 before collapsing to close at 1.79% on Friday.
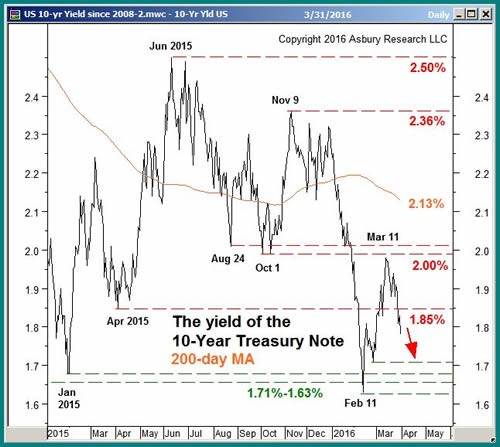
The break below 1.85% clears the way for even more weakness and a potential test of the next key level at 1.71% to 1.63%.
I view declining long-term interest rates as an indication that the bond market, which is typically more prescient and forward-looking than the stock market, is pricing in upcoming economic weakness.
Gold Losing Its Luster?
In the Feb. 16 Market Outlook, I pointed out bullish sentiment in gold was getting frothy, according to a daily survey of retail futures traders. Such bullish extremes coincided with previous peaks in the price of the yellow metal, so I suggested that readers who were long SPDR Gold Shares (NYSE: GLD) per my Dec. 28 report consider locking in some near-term profits.
That turned out to be the right call, as GLD has essentially drifted sideways since then. And on Friday, the daily net assets invested in the fund declined below their 21-day moving average for the first time since Dec. 17.
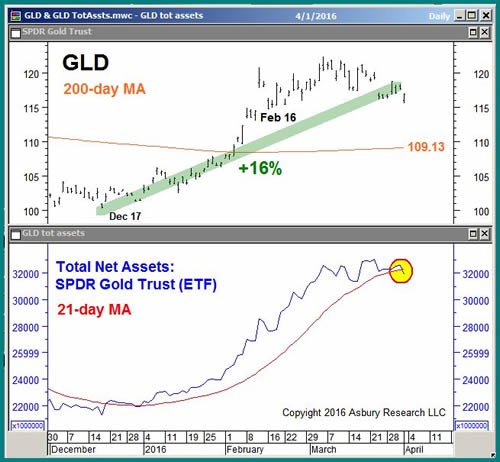
This warns of a new trend of monthly contraction in these assets. If that is indeed the case, it is likely to fuel more near-term weakness and a potential test of GLD’s 200-day moving average at $ 109.13, which is nearly 7% below Friday’s close.
Putting It All Together
Despite last week’s strong rally, investor complacency, weakness in oil prices, seasonality and declining long-term interest rates collectively warn that the U.S. stock market is within weeks of an important top. A bearish reversal from the 2,082 to 2,116 area in the S&P 500 would be evidence that a correction is beginning.
Meanwhile, the recent contraction of investor assets in GLD warns that at least a corrective decline may be getting under way in the yellow metal following an impressive rally off the mid-December lows.
