
A Santa Claus Rally Could Hinge on This Blue Chip
The U.S. stock market featured a lot of fireworks last week but very little in the way of directional movement. All major indices closed less than 1% higher, and the beleaguered small-cap Russell 2000 lost 1.6%.
The good news is that all of this directionless volatility has potentially set the stage for a Santa Claus rally between now and year end. I’ll discuss this in more detail later in the report.
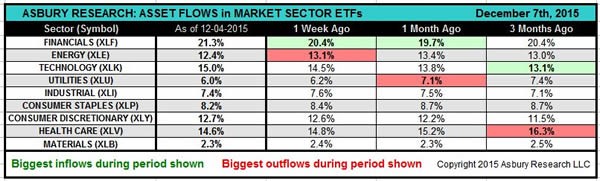
Last week’s strongest sectors were technology, which gained 1.5%, and financial services, which rose 1%. Energy was by far the weakest sector, losing 4.5%, triggered by a drop in West Texas Intermediate (WTI) crude oil prices below $ 40 a barrel to their lowest level since late August.
Not surprisingly, Asbury Research’s metric shows the biggest inflows of sector bet-related assets over the past one-week and one-month periods went into financials, and the biggest outflows came from energy.
S&P 500 Coiling for a Santa Claus Rally?
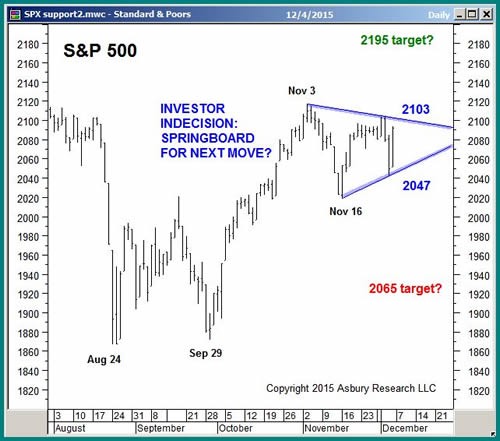
The benchmark S&P 500 has traded in a choppy, sideways manner since early November, developing a triangle pattern that represents near-term investor indecision on the heels of the index’s strong rise from the late-September lows.
A sustained rise above the upper boundary of the indecision area at 2,103 would indicate the September advance has resumed. This would reconfirm the 2,135 initial upside target I identified in the Oct. 19 Market Outlook. A bullish breakout this week would also target a rise to 2,195 — 5% above Friday’s close.
An Apple for Santa?
The next chart may give us a sneak peek of what to expect this week.
On Friday, Apple (AAPL) broke out from a similar period of sideways investor indecision. As long as the upper boundary of the indecision area at $ 118.25 holds as underlying support, the breakout targets a move to $ 125 — also 5% above Friday’s close.
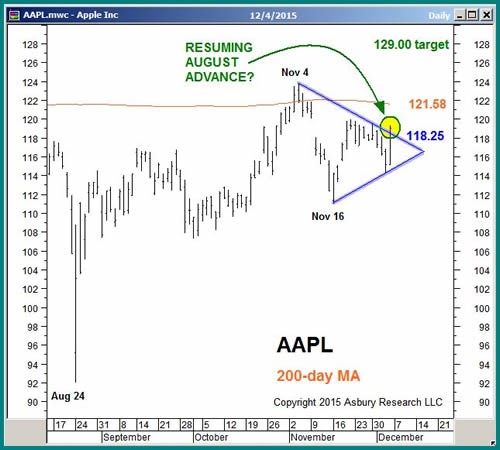
AAPL is the largest U.S. stock according to market capitalization and is positively correlated to both the S&P 500 and Nasdaq 100. So, as goes this technology bellwether, so is likely to go the broader market in December.
Editor’s note: Regardless of which way the market goes, there is a strategy that could make you average annualized gains of 123%. It was created by a former Wall Street prodigy who used it to make $ 600,000 a year by the time he was 18. This same strategy helped his followers book a 63% profit on a 7% move in AAPL in just 38 days. Find out how he did it and how to get his next trade here.
Volatility Supports a December Rally
In the Nov. 23 Market Outlook, I discussed the Volatility S&P 500 Index (VIX) as a valuable tool to help you protect your downside while waiting for a Santa Claus rally to kick in.
The next chart shows two failed attempts to get above the 50-day moving average, on Nov. 16 and Dec. 3, kept investor complacency intact
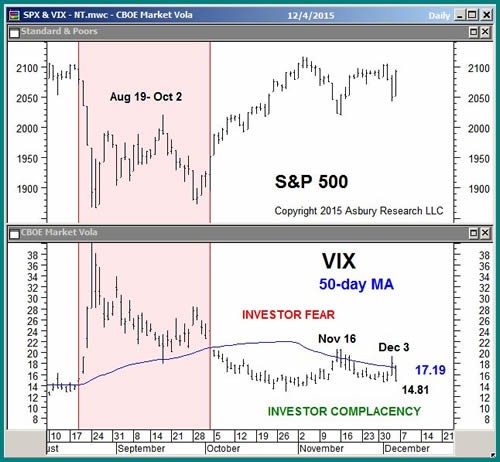
The most recent sustained rise above the 50-day moving average was between Aug. 19 and Oct. 2. It coincided with, or more accurately, triggered and fueled, the decline in the S&P 500 during that period. We also see the sell-off abated as soon as the VIX was able to remain below the moving average.
According to this week’s first two charts, we could see an emerging near-term breakout in the stock market. For that breakout to be sustainable, we must have the necessary investor complacency, which would be signaled by the VIX remaining below 17.19 this week.
Rising Long-Term Interest Rates Another Good Sign
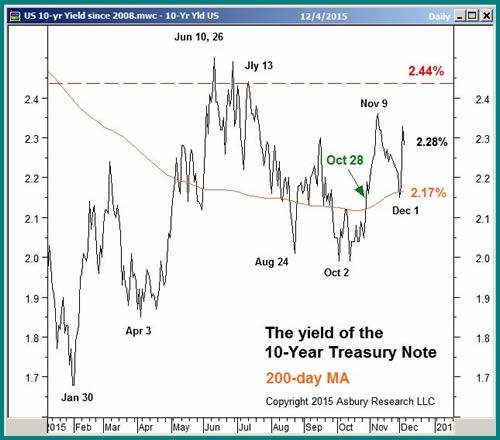
For the past two months, I have been pointing out the significance of the 200-day moving average as a long-term major trend proxy in U.S. 10-year Treasury yields. I said a sustained rise above the 200-day — currently at 2.17% — would be evidence that the forward-looking bond market is betting on an improving U.S. economy.
The next chart shows these yields tested the moving average from above before aggressively rebounding to close out the week at 2.28%. This is an indirect positive for the stock market heading into 2016.
The financial media has been obsessed with the potential ill effects of the first rate hike following years of what has effectively been a zero interest rate policy, but I look at it differently.
Stocks may indeed initially decline following the first rate increase of a new tightening cycle, which is widely expected at the Dec. 15-16 FOMC meeting. But I will view it as evidence the extremely cautious and dovish Federal Reserve is convinced the U.S. economy is strong enough for there to be virtually no risk of having to take that quarter-point rate hike back at a subsequent meeting. A confident Federal Reserve should be an intermediate-term positive for the stock market.
Putting It All Together
The sideways, non-trending activity in several major indices since November is likely to become the springboard for the market’s next one-to-two-month directional move.
As of Friday, the market was leaning toward a Santa Claus rally. This was due to a strong close in market-leading Apple amid low volatility and a strong rebound in long-term U.S. interest rates, which suggest the market is confident enough to support a year-end rally.
However, it would take a sustained rise above 2,103 in the benchmark S&P 500 to confirm this. As I mentioned, this would target an additional 5% rise to 2,195 and be a green light for investors to put additional capital to work.


