The Best And Worst Performing Assets In October And YTD
The torrid October, with its historic S&P500 point rally, is finally in the history books, and at least for a select group of hedge funds such as Glenview, Pershing Square and Greenlight and certainly their L.P.s, a very scary Halloween couldn’t come fast enough, leading to losses between 15% and 20%. How did everyone else fare? Well, if investors had simply bought some of the world’s equity indices unhedged they would have generated substantial profits, suggesting yet again that in a market in which central banks are Chief Risk Officers, there is simply no need to pay 2 and 20 for the privilege of someone else managing downside risk.
Below, courtesy of Deutsche Bank’s Jim Reid, is a summary of what worked in October (and YTD), and what didn’t.
October proved to be generally a good month for risk takers with optimism returning on abating concerns around Chinese growth, ongoing dovishness from the ECB, and a strong rebound after a weak payroll number at the start of the month. 35 out of our oft-tracked 39 global asset benchmarks finished the month in positive territory. The VIX index also fell throughout the month to unwind virtually all of surge we experienced in August. Global equities finished stronger across the board while the EM complex also enjoyed a relief rally after a challenging Q3. That being said we did finish the month on a somewhat softer note possibly on the back of a rather hawkish FOMC meeting last week which left a Dec lift-off back in play.
For November, global equities led the way with the S&P 500, Stoxx600, Nikkei and Hang Seng gaining +8.4%, +8.1%, +9.7% and +8.8%, respectively on a total return basis. This marks the best performance for the S&P 500 since October 2011 and the best monthly display for the Stoxx600 since the Summer of 2009. For the Nikkei it was the best month since April 2013 (post fresh BOJ QE announcement) and for the Hang Seng its first positive month in 6 months. The Shanghai Composite posted its first gain since the market correction began in June. The Chinese equity benchmark was up nearly 11% on a total return basis in October, interesting bringing the index back into positive territory YTD (+6.2%). Elsewhere in EM YTD returns are still weak with for example Brazil’s BOVESPA still down by around 8% in local currency terms and down 37% in USD terms.
EM bonds also did well in October with the broad market EM bond index showing its best monthly performance this year. Indeed Latam bonds did particularly well largely helped by abating bearishness on Brazil. Indeed Brazil joined the broad based rally in EM credit in October with its 5yr CDS narrowing by 39bp in the past month. For the record, the 5yr CDS spread on Mexico, Turkey, Russia, South Africa, and Indonesia were 25bps, 60bps, 87bps, 40bps, and 50bps tighter in October, respectively.
It is perhaps not surprising that the rally in EM also coincided with a somewhat better tone in commodities. The CRB index posted its first gain (albeit a modest 1%) in four months whereas WTI and Brent were up around 3%.
Turning to DM, core rates saw a slight divergence between US and Europe largely reflecting the differing monetary policy developments in October. US Treasuries finished the month slightly down (-0.3%) as long end rates reacted negatively to the FOMC’s statement during the last week of October. In contrast, Bunds and European sovereigns outperformed as ECB remains likely to provide more liquidity soon. Credit had a good month led by HY with Euro HY up +3.1% and US HY up +4.1%. IG excess returns were decent, seeing around 1% on both sides of the Atlantic.
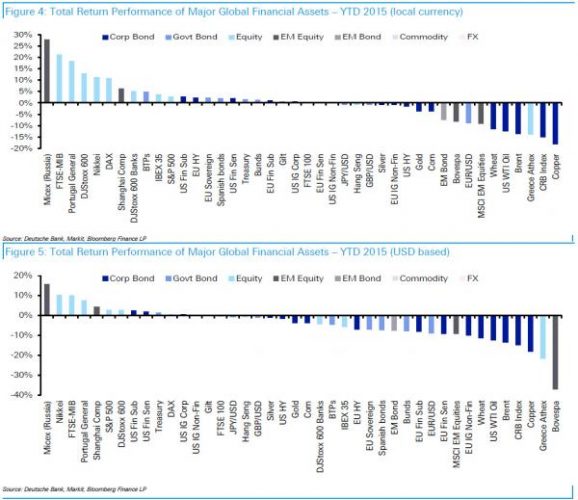
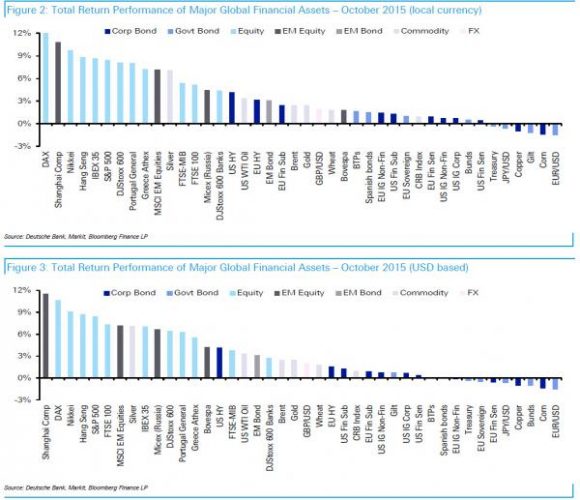
Here are the full October returns in local currency and USD terms:
And 2015 YTD returns across the globe: