
| Symbol | Last | Change | % | High | Low |
|---|---|---|---|---|---|
| HANG SENG – HONG KONG | 25,203.8 | +311.1 | +1.25% | 25,267.4 | 24,876.8 |
| Open Last Trade : 13:46 | Hong Kong Time : Thu Jul 23 2026 13:47 | ||||
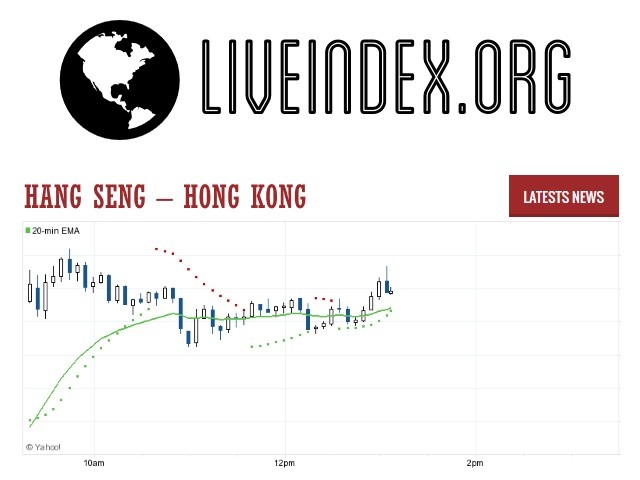
Hang Seng : Intraday Live Chart
Hang Seng : Technical Signal Buy & Sell
| 5 Min Signal | 1 Hour Signal | 1 Day Signal |
|---|---|---|
| Buy | Sell | Buy |
Hang Seng : Moving Averages
| Period | MA 20 | MA 50 | MA 100 |
|---|---|---|---|
| 5 Minutes | 25228.72 | 25169.45 | 25032.43 |
| 1 Hour | 24940.64 | 25024.50 | 24932.75 |
| 1 Day | 24193.91 | 23639.71 | 24777.74 |
| 1 Week | 25083.39 | 25698.64 | 23546.78 |
Hang Seng : Technical Resistance Level
| Resistance 1 - R1 | Resistance 2 - R2 | Resistance 3 - r3 |
|---|---|---|
| 8,388.3 | 177.8 | 8,566.1 |
Hang Seng : Technical Support Level
| Support 1 - S1 | Support 2 - S2 | Support 3 - S3 |
|---|---|---|
| 8,210.5 | -177.8 | 8,032.7 |
Hang Seng : Periodical High, Low & Average
| Period | High Change from Last | Low Change from Last | Average Change from Last |
|---|---|---|---|
| 1 Week | 25,221.2 -17.4 | 24,332.5 +871.3 | 24,837.6 +366.2 |
| 1 Month | 25,221.2 -17.4 | 22,518.0 +2,685.8 | 23,823.4 +1,380.4 |
| 3 Month | 26,669.3 -1,465.5 | 0.0 +25,203.8 | 24,585.3 +618.5 |
| 6 Month | 28,053.0 -2,849.2 | 0.0 +25,203.8 | 25,351.4 -147.6 |
| 1 Year | 28,053.0 -2,849.2 | 0.0 +25,203.8 | 25,644.8 -441.0 |
Hang Seng : Historical Chart
Related News


The Hang Seng Index is a free float-adjusted market capitalization-weighted stock market index in Hong Kong. It is used to record and monitor daily changes of the largest companies of the Hong Kong stock market and is the main indicator of the overall market performance in Hong Kong. These 45 companies represent about 67% of capitalization of the Hong Kong Stock Exchange.
HSI was started on November 24, 1969, and is currently compiled and maintained by HSI Services Limited, which is a wholly owned subsidiary of Hang Seng Bank, the largest bank registered and listed in Hong Kong in terms of market capitalisation. It is responsible for compiling, publishing and managing the Hang Seng Index and a range of other stock indexes, such as Hang Seng China AH Index Series, Hang Seng China Enterprises Index, Hang Seng China H-Financials Index, Hang Seng Composite Index Series, Hang Seng Freefloat Index Series and Hang Seng Total Return Index Series.
When the Hang Seng Index was first published, its base of 100 points was set equivalent to the stocks’ total value as of the market close on July 31, 1964. Its all-time low is 58.61 points, reached retroactively on August 31, 1967, after the base value was established but before the publication of the index. The Hang Seng passed the 10,000 point milestone for the first time in its history on December 10, 1993 and, 13 years later, passed the 20,000 point milestone on December 28, 2006. In less than 10 months, it passed the 30,000 point milestone on October 18, 2007. Its all-time high, set on October 30, 2007, was 31,958.41 points during trading and 31,638.22 points at closing. From October 30, 2007 through March 9, 2008, the index lost 9,426 points or approximately 30%. On September 5, it fell past the 20,000 mark the first time in almost a year to a low of 19,708.39, later closing at 19,933.28. On October 8, 2008, the index closed at 15,431.73, over 50% less than the all-time high and the lowest closing value in over two years. On October 27, 2008, the index fell to 10,676 points, having fallen nearly two-thirds from its all-time peak.
Hang Seng - HSI Index | Hang Seng Live Quotes | Hong Kong Index
Live Price of Hang Seng. Hang Seng Live Chart, Hang Seng Intraday & Historical Live Chart. Hang Seng Buy Sell Signal, Hang Seng News, Hang Seng Videos, Hang Seng Averages, Returns & Historical Data
» Hang Seng
» Hang Seng Real Time Quotes
» Hang Seng Live Chart
» Hang Seng Intraday Chart
» Hang Seng Historical Chart
» Hang Seng Buy Sell Signal
» Hang Seng News
» Hang Seng Videos
» Hang Seng Averages
» Hang Seng Returns
» Hang Seng Historical Data