
| Symbol | Last | Change | % | High | Low |
|---|---|---|---|---|---|
| BEL – BELGIUM | 3,874.87 | +16.93 | +0.44% | 3,883.11 | 3,856.77 |
| Close | Belgium Time : Sat Apr 27 2024 03:54 | ||||
BEL 20 : Intraday Live Chart
BEL 20 : Technical Signal Buy & Sell
| 5 Min Signal | 1 Hour Signal | 1 Day Signal |
|---|---|---|
| Sell | Sell | Buy |
BEL 20 : Moving Averages
| Period | MA 20 | MA 50 | MA 100 |
|---|---|---|---|
| 5 Minutes | 3874.93 | 3876.13 | 3870.47 |
| 1 Hour | 3864.05 | 3873.33 | 3875.90 |
| 1 Day | 3843.26 | 3802.06 | 3729.79 |
| 1 Week | 3728.00 | 3579.98 | 3654.07 |
BEL 20 : Technical Resistance Level
| Resistance 1 - R1 | Resistance 2 - R2 | Resistance 3 - r3 |
|---|---|---|
| 3,878.16 | 3,888.85 | 3,904.50 |
BEL 20 : Technical Support Level
| Support 1 - S1 | Support 2 - S2 | Support 3 - S3 |
|---|---|---|
| 3,851.82 | 3,836.17 | 3,825.48 |
BEL 20 : Periodical High, Low & Average
| Period | High Change from Last | Low Change from Last | Average Change from Last |
|---|---|---|---|
| 1 Week | 3,919.25 -44.38 | 3,792.46 +82.41 | 3,860.87 +14.00 |
| 1 Month | 3,919.25 -44.38 | 3,774.50 +100.37 | 3,843.95 +30.92 |
| 3 Month | 3,919.25 -44.38 | 3,608.11 +266.76 | 3,744.95 +129.92 |
| 6 Month | 3,919.25 -44.38 | 3,288.83 +586.04 | 3,670.13 +204.74 |
| 1 Year | 3,919.25 -44.38 | 0.00 +3,874.87 | 3,610.76 +264.11 |
BEL 20 : Historical Chart
Group by:
Related News


About BEL – Belgium 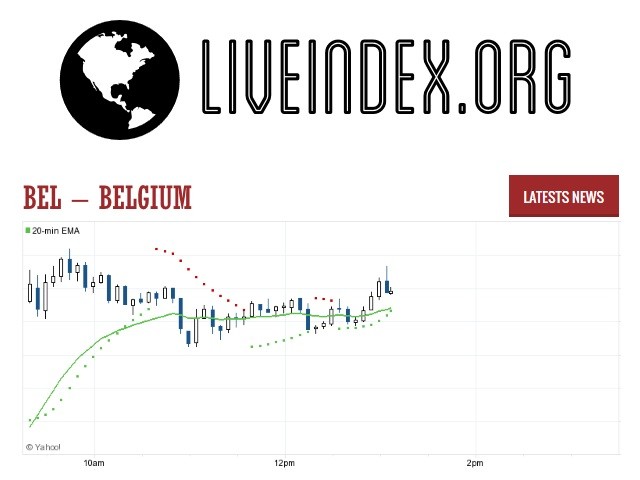
BEL - BEL 20 Index | BEL 20 Live Quotes | Austria Index
Live Price of BEL. BEL Live Chart, BEL Intraday & Historical Live Chart. BEL Buy Sell Signal, BEL News, BEL Videos, BEL Averages, Returns & Historical Data
» BEL
» BEL Real Time Quotes
» BEL Live Chart
» BEL Intraday Chart
» BEL Historical Chart
» BEL Buy Sell Signal
» BEL News
» BEL Videos
» BEL Averages
» BEL Returns
» BEL Historical Data