
| Symbol | Last | Change | % | High | Low |
|---|---|---|---|---|---|
| BEL – BELGIUM | 5,685.82 | +30.82 | +0.55% | 5,735.73 | 5,654.85 |
| Close | Belgium Time : Fri Jul 31 2026 20:43 | ||||
BEL 20 : Intraday Live Chart
BEL 20 : Technical Signal Buy & Sell
| 5 Min Signal | 1 Hour Signal | 1 Day Signal |
|---|---|---|
| Sell | Sell | Sell |
BEL 20 : Moving Averages
| Period | MA 20 | MA 50 | MA 100 |
|---|---|---|---|
| 5 Minutes | 5685.82 | 5686.12 | 5704.99 |
| 1 Hour | 5682.08 | 5691.93 | 5709.97 |
| 1 Day | 5658.49 | 5688.60 | 5588.33 |
| 1 Week | 5478.01 | 5227.12 | 4698.87 |
BEL 20 : Technical Resistance Level
| Resistance 1 - R1 | Resistance 2 - R2 | Resistance 3 - r3 |
|---|---|---|
| 5,717.67 | 5,756.84 | 5,778.29 |
BEL 20 : Technical Support Level
| Support 1 - S1 | Support 2 - S2 | Support 3 - S3 |
|---|---|---|
| 5,657.05 | 5,635.60 | 5,596.43 |
BEL 20 : Periodical High, Low & Average
| Period | High Change from Last | Low Change from Last | Average Change from Last |
|---|---|---|---|
| 1 Week | 5,775.25 -89.43 | 5,639.34 +46.48 | 5,717.64 -31.82 |
| 1 Month | 5,817.71 -131.89 | 5,563.82 +122.00 | 5,683.21 +2.61 |
| 3 Month | 5,817.71 -131.89 | 5,244.38 +441.44 | 5,612.81 +73.01 |
| 6 Month | 5,817.71 -131.89 | 4,774.82 +911.00 | 5,489.87 +195.95 |
| 1 Year | 5,817.71 -131.89 | 4,532.44 +1,153.38 | 5,215.52 +470.30 |
BEL 20 : Historical Chart
Group by:
Related News


About BEL – Belgium 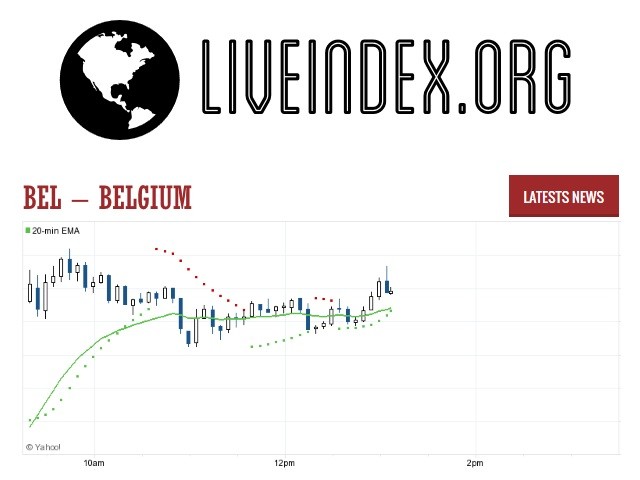
BEL - BEL 20 Index | BEL 20 Live Quotes | Austria Index
Live Price of BEL. BEL Live Chart, BEL Intraday & Historical Live Chart. BEL Buy Sell Signal, BEL News, BEL Videos, BEL Averages, Returns & Historical Data
» BEL
» BEL Real Time Quotes
» BEL Live Chart
» BEL Intraday Chart
» BEL Historical Chart
» BEL Buy Sell Signal
» BEL News
» BEL Videos
» BEL Averages
» BEL Returns
» BEL Historical Data