
| Symbol | Last | Change | % | High | Low |
|---|---|---|---|---|---|
| USD / SGD | 1.2756 | +0.0023 | +0.18% | 1.2787 | 1.2741 |
| Open Last Trade : 09:12 | GMT Time : Mon Apr 13 2026 09:12 | ||||
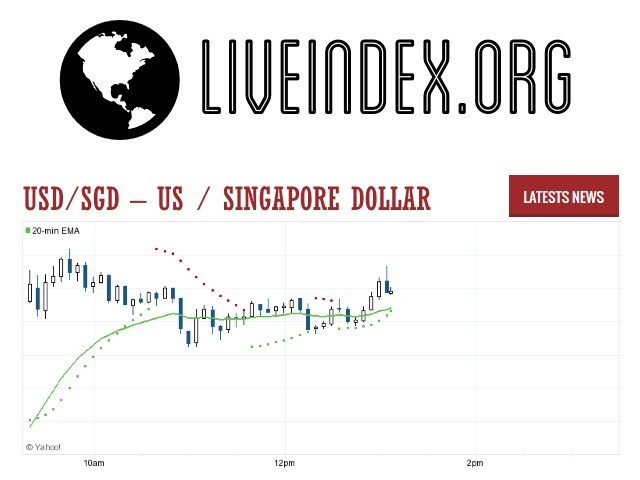
USD/SGD : Intraday Live Chart
USD/SGD : Technical Signal Buy & Sell
| 5 Min Signal | 1 Hour Signal | 1 Day Signal |
|---|---|---|
| Sell | Buy | Buy |
USD/SGD : Moving Averages
| Period | MA 20 | MA 50 | MA 100 |
|---|---|---|---|
| 5 Minutes | 1.28 | 1.28 | 1.28 |
| 1 Hour | 1.27 | 1.27 | 1.27 |
| 1 Day | 1.28 | 1.25 | 1.26 |
| 1 Week | 1.28 | 1.29 | 1.31 |
USD/SGD : Technical Resistance Level
| Resistance 1 - R1 | Resistance 2 - R2 | Resistance 3 - r3 |
|---|---|---|
| 1.2768 | 1.2781 | 1.2814 |
USD/SGD : Technical Support Level
| Support 1 - S1 | Support 2 - S2 | Support 3 - S3 |
|---|---|---|
| 1.2722 | 1.2689 | 1.2676 |
USD/SGD : Periodical High, Low & Average
| Period | High Change from Last | Low Change from Last | Average Change from Last |
|---|---|---|---|
| 1 Week | 1.2852 -0.0096 | 0.0000 +1.2756 | 1.2758 -0.0002 |
| 1 Month | 1.2922 -0.0166 | 0.0000 +1.2756 | 1.2819 -0.0063 |
| 3 Month | 1.2922 -0.0166 | 0.0000 +1.2756 | 1.2586 +0.0170 |
| 6 Month | 1.3080 -0.0324 | 0.0000 +1.2756 | 1.2780 -0.0024 |
| 1 Year | 1.3209 -0.0453 | 0.0000 +1.2756 | 1.2835 -0.0079 |
USD/SGD : Historical Chart
Related News


USD/SGD Exchange Rate History and Economic Drivers
The USD/SGD currency pair represents the exchange rate between the U.S. dollar (USD) and the Singapore dollar (SGD), a key barometer of macroeconomic trends in Southeast Asia and a crucial indicator in global forex markets. As Singapore has grown into a major financial hub with a highly open economy, the SGD’s behavior against the USD has attracted increasing attention from investors, central banks, and multinational corporations. This article offers a detailed historical analysis of the USD/SGD exchange rate, explores the main economic and policy-driven influences over time, and presents a decade-wise performance comparison — all optimized for search queries like USD/SGD historical exchange rate, Singapore dollar to US dollar history, and USD to SGD trend analysis.
Foundations and Early Currency Management (Pre-1980s)
The Singapore dollar was introduced in 1967 after Singapore’s brief monetary union with Malaysia ended. Initially pegged to the British pound and later to a trade-weighted basket of currencies, the SGD evolved as Singapore’s economy expanded rapidly through industrialization and export-led growth. The Monetary Authority of Singapore (MAS) adopted a managed float regime, allowing the SGD to adjust within undisclosed parameters to maintain competitiveness and price stability.
In the 1970s, with the collapse of the Bretton Woods system and the global shift to floating exchange rates, the USD began to fluctuate more freely. Meanwhile, Singapore continued its path of strong economic fundamentals, disciplined monetary policy, and capital inflows, which made the SGD more resilient than many other emerging market currencies. During this early phase, the USD/SGD pair moved within a relatively stable band, with gradual appreciation of the SGD due to robust economic performance and strict exchange rate management by the MAS.
Volatility Amid Global Economic Realignments (1980s–1990s)
The 1980s brought global currency volatility as the U.S. dollar strengthened sharply under tight monetary policy and rising interest rates. However, Singapore’s strong current account surplus and disciplined exchange rate regime kept the SGD relatively steady. Between 1980 and 1990, the SGD gradually appreciated against the USD, moving from above 2.20 to around 1.70 by the end of the decade.
The 1990s saw continued strength in Singapore’s fundamentals—low inflation, consistent growth, and rising productivity. However, the Asian Financial Crisis of 1997–1998 tested the SGD’s resilience. While many Asian currencies depreciated massively, the SGD managed to avoid a full-blown collapse, though it did weaken temporarily from around 1.40 to 1.80 per USD during the crisis. The MAS’s consistent stance on monetary stability, combined with ample reserves and prudent financial governance, helped the SGD recover faster than its regional peers.
New Millennium and Post-Crisis Realignment (2000s)
The 2000s were marked by significant geopolitical and economic shifts including the tech bubble burst, 9/11, and the 2008 global financial crisis. The USD saw bouts of weakness due to low interest rates and quantitative easing in the United States. Singapore maintained its managed float, allowing the SGD to appreciate gradually. The exchange rate shifted from around 1.75 in 2000 to about 1.45 by the end of the decade, reflecting increasing investor confidence in the Singaporean economy.
The MAS continued to use exchange rate policy, rather than interest rate adjustments, as its main monetary tool. This approach, focused on allowing SGD appreciation in line with economic growth while guarding against inflationary pressures, maintained the stability of the USD/SGD rate. Singapore’s position as a financial and trading hub continued to attract foreign investment, further strengthening the SGD over the decade.
Post-2008 Recovery, Pandemic Shock, and Policy Divergence (2010s–2020s)
In the aftermath of the 2008 financial crisis, both the Federal Reserve and MAS adopted accommodative monetary policies. However, the pace and scale of recovery diverged between the U.S. and Singapore. While the U.S. slowly raised interest rates in the mid-2010s, Singapore experienced moderate growth with a focus on technological innovation and financial services expansion.
By the end of the 2010s, the SGD had appreciated modestly, hovering around 1.35–1.40 per USD. The onset of the COVID-19 pandemic in 2020 initially caused the SGD to weaken slightly due to investor risk aversion. However, Singapore’s effective pandemic response, fiscal stimulus, and early reopening helped the SGD rebound quickly.
From 2021 onward, the U.S. Federal Reserve embarked on an aggressive tightening cycle to combat inflation, strengthening the USD globally. Conversely, MAS adjusted its SGD policy band to allow a gradual appreciation path. As of early 2025, the USD/SGD rate stands around 1.345, demonstrating the balance between tighter U.S. policy and Singapore’s steady economic performance.
USD/SGD Exchange Rate by Decade
Below is a verified decade-wise overview of the USD/SGD exchange rate, capturing average values, directional changes, and major economic events that influenced the pair:
| Decade | Avg. USD/SGD Rate | Change vs. Prior Decade | Key Economic Milestones |
|---|---|---|---|
| 1970s | ~2.60 (est.) | — | Post-independence policy formation; SGD peg to currency basket |
| 1980s | 2.00 | 🟢 -23% | U.S. dollar peak; SGD appreciates on robust growth |
| 1990s | 1.60 | 🟢 -20% | Asian financial crisis; resilient SGD due to strong MAS reserves |
| 2000s | 1.45 | 🟢 -9.3% | Dot-com crash, GFC; SGD gradually strengthens amid safe-haven demand |
| 2010s | 1.35 | 🟢 -6.9% | Low inflation; MAS gradual appreciation stance |
| 2020s* | 1.345 | 🔴 +0.3% | COVID-19 recovery; Fed tightening offsets SGD strength |
*2020s data is current as of April 2025
🟢 = SGD appreciated vs. USD | 🔴 = SGD depreciated vs. USD
Key Drivers of the USD/SGD Exchange Rate
The USD/SGD currency pair is uniquely shaped by the divergence in monetary policy frameworks between the Federal Reserve and Monetary Authority of Singapore. While the Fed targets interest rates directly to achieve inflation and employment goals, MAS uses the nominal effective exchange rate (S$NEER) to control imported inflation and maintain competitiveness. This fundamental difference means the USD/SGD often reacts differently than other major USD crosses during global economic shifts.
In times of U.S. monetary tightening, the USD typically strengthens, pushing USD/SGD higher. However, MAS’s proactive adjustments to the SGD policy band help counterbalance this, ensuring stability. Conversely, during periods of global risk-off sentiment, the SGD may weaken slightly, but Singapore’s high reserve levels and current account surplus buffer against severe depreciation.
Other important factors influencing the USD/SGD pair include:
Trade and export flows: As a trade-dependent economy, Singapore’s SGD is highly sensitive to global trade conditions and regional demand, especially from China and the U.S.
Commodity prices: As a non-commodity producing country, Singapore benefits from low commodity prices, which indirectly affects the SGD via inflation and trade balance.
Foreign investment and portfolio flows: Singapore’s role as a global financial center ensures capital inflows remain strong, supporting the SGD.
USD/SGD - US Dollar / Singapore Dollar Currency Rate
Live Price of USD/SGD. USD/SGD Live Chart, Intraday & Historical Live Chart, Buy Sell Signal, USD/SGD News, USD/SGD Averages, Returns & Historical Data
» USD/SGD
» USD/SGD Real Time Quotes
» USD/SGD Live Chart
» USD/SGD Intraday Chart
» USD/SGD Historical Chart
» USD/SGD Buy Sell Signal
» USD/SGD News
» USD/SGD Videos
» USD/SGD Averages
» USD/SGD Currency Pair
» USD/SGD Historical Data