
| Symbol | Last | Change | % | High | Low |
|---|---|---|---|---|---|
| STI – SINGAPORE | 5,581.76 | -13.66 | -0.24% | 5,590.39 | 5,546.44 |
| Close | Singapore Time : Thu Jul 23 2026 21:01 | ||||
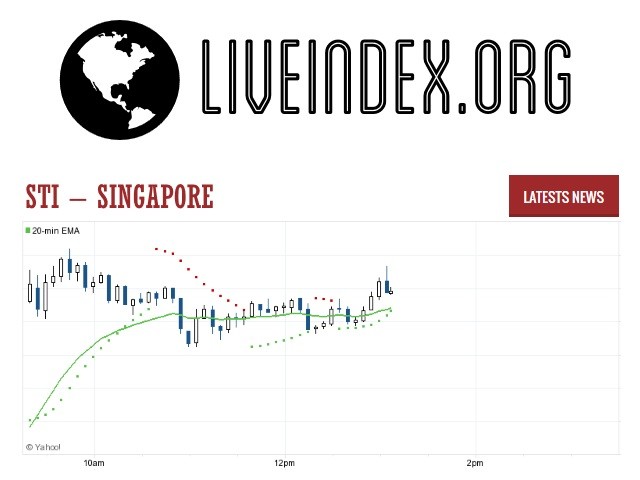
STI : Intraday Live Chart
STI : Technical Signal Buy & Sell
| 5 Min Signal | 1 Hour Signal | 1 Day Signal |
|---|---|---|
| Buy | Buy | Buy |
STI : Moving Averages
| Period | MA 20 | MA 50 | MA 100 |
|---|---|---|---|
| 5 Minutes | 5577.52 | 5568.16 | 5565.36 |
| 1 Hour | 5582.91 | 5557.49 | 5532.81 |
| 1 Day | 5427.52 | 5246.36 | 5114.65 |
| 1 Week | 5072.46 | 4734.94 | 4254.50 |
STI : Technical Resistance Level
| Resistance 1 - R1 | Resistance 2 - R2 | Resistance 3 - r3 |
|---|---|---|
| 5,583.44 | 5,633.64 | 5,695.82 |
STI : Technical Support Level
| Support 1 - S1 | Support 2 - S2 | Support 3 - S3 |
|---|---|---|
| 5,471.06 | 5,408.88 | 5,358.68 |
STI : Periodical High, Low & Average
| Period | High Change from Last | Low Change from Last | Average Change from Last |
|---|---|---|---|
| 1 Week | 5,595.42 -13.66 | 5,483.04 +98.72 | 5,526.97 +54.79 |
| 1 Month | 5,595.42 -13.66 | 5,155.95 +425.81 | 5,357.82 +223.94 |
| 3 Month | 5,595.42 -13.66 | 4,853.78 +727.98 | 5,131.53 +450.23 |
| 6 Month | 5,595.42 -13.66 | 4,697.52 +884.24 | 5,039.14 +542.62 |
| 1 Year | 5,595.42 -13.66 | 4,144.89 +1,436.87 | 4,727.84 +853.92 |
STI : Historical Chart
Related News


The FTSE Straits Times Index (STI) is a capitalization-weighted stock market index that is regarded as the benchmark index for the Singapore stock market. It tracks the performance of the top 30 companies listed on the Singapore Exchange. It is jointly calculated by Singapore Press Holdings (SPH), Singapore Exchange (SGX) and FTSE Group (FTSE).
The STI has a history dating back to 1966. Following a major sectoral re-classification of listed companies by the Singapore Exchange, which saw the removal of the “industrials” category, the STI replaced the Straits Times Industrials Index (STII) and began trading on 31 August 1998 at 885.26 points, in continuation of where the STII left off. At the time, it represented 78% of the average daily traded value over a 12-month period and 61.2% of total market capitalization on the exchange. The STI was constructed by SPH, the Singapore Exchange and SPH’s consultant, Professor Tse Yiu Kuen from the Singapore Management University (formerly from the National University of Singapore). It came under formal review at least once annually and was also reviewed on an ad-hoc basis when necessary. One such review, for instance, raised the number of stocks from 45 to 50, which took effect when trading resumed on 18 March 2005. This change reduced the index representation of the average daily traded value to 60%, while increasing its total market capitalization to 75%.
The STI was again revamped and relaunched in January 2008. As part of a new partnership between SPH, SGX and FTSE, the number of constituent stocks was reduced from about 50 to 30 and the index was re-calculated using FTSE’s methodology. Besides the STI, the partners also developed a family of indices including the FTSE ST Dividend Index, FTSE ST China Top tradable index, FTSE ST Catalist Index and FTSE ST Maritime Index as well as 19 Supersector and 39 Sector indices. For the purposes of computing the indices, stocks are classified using the Industry Classification Benchmark (ICB).
The creation of the FTSE ST Index Series was intended to facilitate the creation of financial products such as institutional and retail funds, exchange-traded funds (ETFs), derivatives contracts and other index-linked products. There are currently two ETFs listed on the SGX that track the STI: the SPDR Straits Times Index ETF (formerly known as the streetTRACKS Straits Times Index Fund) (managed by State Street Global Advisors) and the DBS Singapore STI ETF.
STI - STI 30 Index | STI 30 Live Quotes | Singapore Index
Live Price of STI. STI Live Chart, STI Intraday & Historical Live Chart. STI Buy Sell Signal, STI News, STI Videos, STI Averages, Returns & Historical Data
» STI
» STI Real Time Quotes
» STI Live Chart
» STI Intraday Chart
» STI Historical Chart
» STI Buy Sell Signal
» STI News
» STI Videos
» STI Averages
» STI Returns
» STI Historical Data