
| Symbol | Last | Change | % | High | Low |
|---|---|---|---|---|---|
| S&P TSX – CANADA | 33,893.6 | +197.9 | +0.59% | 33,913.5 | 33,548.0 |
| Close | Canada Time : Mon Apr 13 2026 13:46 | ||||
S&P TSX : Intraday Live Chart
S&P TSX : Technical Signal Buy & Sell
| 5 Min Signal | 1 Hour Signal | 1 Day Signal |
|---|---|---|
| Sell | Sell |
S&P TSX : Moving Averages
| Period | MA 20 | MA 50 | MA 100 |
|---|---|---|---|
| 5 Minutes | |||
| 1 Hour | 33693.11 | 33694.67 | 33646.94 |
| 1 Day | 32794.11 | 33131.23 | 32537.67 |
| 1 Week | 32440.67 | 29742.09 | 26868.30 |
S&P TSX : Technical Resistance Level
| Resistance 1 - R1 | Resistance 2 - R2 | Resistance 3 - r3 |
|---|---|---|
| 33,694.5 | 33,777.7 | 33,944.0 |
S&P TSX : Technical Support Level
| Support 1 - S1 | Support 2 - S2 | Support 3 - S3 |
|---|---|---|
| 33,445.0 | 33,278.7 | 33,195.5 |
S&P TSX : Periodical High, Low & Average
| Period | High Change from Last | Low Change from Last | Average Change from Last |
|---|---|---|---|
| 1 Week | 33,862.5 +31.1 | 32,931.1 +962.5 | 33,515.0 +378.6 |
| 1 Month | 33,862.5 +31.1 | 31,146.3 +2,747.3 | 32,636.3 +1,257.3 |
| 3 Month | 34,544.5 -650.9 | 31,146.3 +2,747.3 | 32,607.2 +1,286.4 |
| 6 Month | 34,544.5 -650.9 | 29,530.9 +4,362.7 | 31,775.5 +2,118.1 |
| 1 Year | 34,544.5 -650.9 | 23,038.7 +10,854.9 | 29,465.7 +4,427.9 |
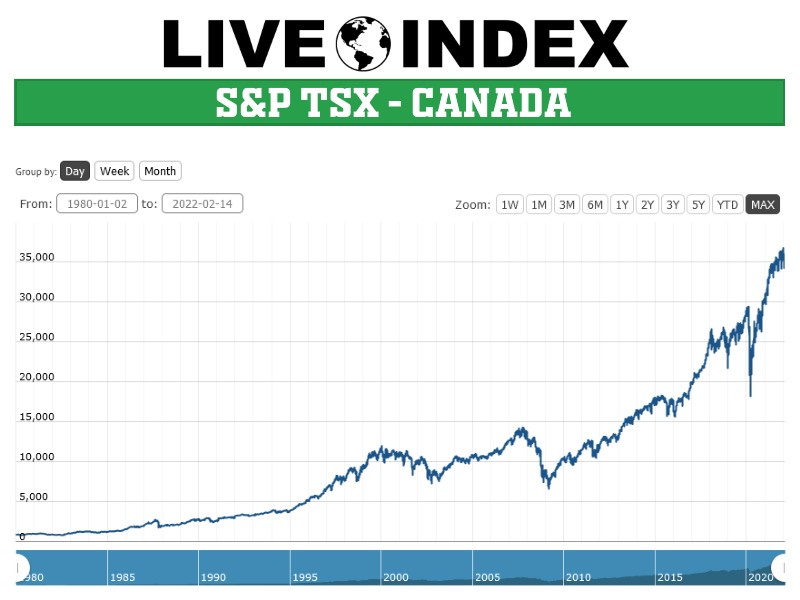
S&P TSX : Historical Chart
Related News


The S&P/TSX Composite is an index of the stock (equity) prices of the largest companies on the Toronto Stock Exchange (TSX) as measured by market capitalization. The Toronto Stock Exchange listed companies in this index comprise about 70% of market capitalization for all Canadian-based companies listed on the TSX. It replaces the earlier TSE 300 index.
S&P TSX - S&P TSX 60 Index | S&P/TSX 60 Live Quotes | Canada Index
Live Price of S&P TSX. S&P TSX Live Chart, S&P TSX Intraday & Historical Live Chart. S&P TSX Buy Sell Signal, S&P TSX News, S&P TSX Videos, S&P TSX Averages, Returns & Historical Data
» S&P TSX
» S&P TSX Real Time Quotes
» S&P TSX Live Chart
» S&P TSX Intraday Chart
» S&P/TSX Historical Chart
» S&P/TSX Buy Sell Signal
» S&P TSX News
» S&P TSX Videos
» S&P TSX Averages
» S&P TSX Returns
» S&P TSX Historical Data