
| Symbol | Last | Change | % | High | Low |
|---|---|---|---|---|---|
| OSE ALL SHARE – NORWAY | 2,428.84 | +31.84 | +1.33% | 2,435.32 | 2,397.01 |
| Open Last Trade : 09:06 | Norway Time : Mon Apr 13 2026 09:07 | ||||
OSE All Share : Intraday Live Chart
OSE All Share : Technical Signal Buy & Sell
| 5 Min Signal | 1 Hour Signal | 1 Day Signal |
|---|---|---|
| Neutral | Neutral | Buy |
OSE All Share : Moving Averages
| Period | MA 20 | MA 50 | MA 100 |
|---|---|---|---|
| 5 Minutes | 2428.84 | 2428.84 | 2428.84 |
| 1 Hour | 2397.00 | 2397.00 | 2401.47 |
| 1 Day | 2316.39 | 2209.23 | 2076.11 |
| 1 Week | 2028.81 | 1895.36 | 1753.65 |
OSE All Share : Technical Resistance Level
| Resistance 1 - R1 | Resistance 2 - R2 | Resistance 3 - r3 |
|---|---|---|
| 2,433.93 | 2,458.61 | 2,471.98 |
OSE All Share : Technical Support Level
| Support 1 - S1 | Support 2 - S2 | Support 3 - S3 |
|---|---|---|
| 2,395.88 | 2,382.51 | 2,357.83 |
OSE All Share : Periodical High, Low & Average
| Period | High Change from Last | Low Change from Last | Average Change from Last |
|---|---|---|---|
| 1 Week | 2,472.66 -43.82 | 2,350.27 +78.57 | 2,407.14 +21.70 |
| 1 Month | 2,472.66 -43.82 | 2,268.74 +160.10 | 2,356.21 +72.63 |
| 3 Month | 2,472.66 -43.82 | 1,964.84 +464.00 | 2,161.18 +267.66 |
| 6 Month | 2,472.66 -43.82 | 1,832.69 +596.15 | 2,036.08 +392.76 |
| 1 Year | 2,472.66 -43.82 | 1,596.91 +831.93 | 1,920.29 +508.55 |
OSE All Share : Historical Chart
Group by:
Related News


About OSE All Share – Norway 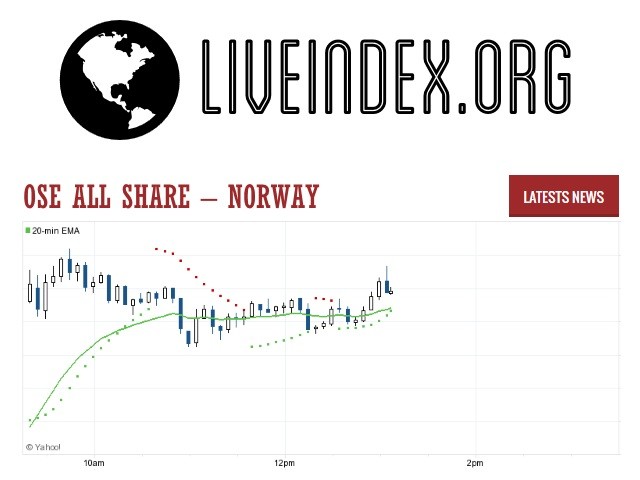
OSEAX is the index of Norway . It is traded in Oslo
OSE All Share - OSE All Share Index | OSE All Share Live Quotes | Netherlands Index
Live Price of OSE All Share. OSE All Share Live Chart, OSE All Share Intraday & Historical Live Chart. OSE All Share Buy Sell Signal, OSE All Share News, OSE All Share Videos, OSE All Share Averages, Returns & Historical Data
» OSE All Share
» OSE All Share Real Time Quotes
» OSE All Share Live Chart
» OSE All Share Intraday Chart
» OSE All Share Historical Chart
» OSE All Share Buy Sell Signal
» OSE All Share News
» OSE All Share Videos
» OSE All Share Averages
» OSE All Share Returns
» OSE All Share Historical Data