
| Symbol | Last | Change | % | High | Low |
|---|---|---|---|---|---|
| OSE ALL SHARE – NORWAY | 2,390.04 | +12.96 | +0.55% | 2,394.03 | 2,371.96 |
| Open Last Trade : 14:48 | Norway Time : Fri Jul 31 2026 14:49 | ||||
OSE All Share : Intraday Live Chart
OSE All Share : Technical Signal Buy & Sell
| 5 Min Signal | 1 Hour Signal | 1 Day Signal |
|---|---|---|
| Buy | Buy | Buy |
OSE All Share : Moving Averages
| Period | MA 20 | MA 50 | MA 100 |
|---|---|---|---|
| 5 Minutes | 2388.25 | 2387.74 | 2387.74 |
| 1 Hour | 2379.56 | 2376.90 | 2364.92 |
| 1 Day | 2324.73 | 2294.19 | 2324.63 |
| 1 Week | 2312.20 | 2074.13 | 1876.37 |
OSE All Share : Technical Resistance Level
| Resistance 1 - R1 | Resistance 2 - R2 | Resistance 3 - r3 |
|---|---|---|
| 2,385.42 | 2,394.10 | 2,404.48 |
OSE All Share : Technical Support Level
| Support 1 - S1 | Support 2 - S2 | Support 3 - S3 |
|---|---|---|
| 2,366.36 | 2,355.98 | 2,347.30 |
OSE All Share : Periodical High, Low & Average
| Period | High Change from Last | Low Change from Last | Average Change from Last |
|---|---|---|---|
| 1 Week | 2,390.30 -0.26 | 2,336.55 +53.49 | 2,370.46 +19.58 |
| 1 Month | 2,392.06 -2.02 | 2,209.33 +180.71 | 2,304.73 +85.31 |
| 3 Month | 2,435.61 -45.57 | 2,208.74 +181.30 | 2,324.48 +65.56 |
| 6 Month | 2,472.66 -82.62 | 2,004.54 +385.50 | 2,288.29 +101.75 |
| 1 Year | 2,472.66 -82.62 | 1,832.69 +557.35 | 2,101.52 +288.52 |
OSE All Share : Historical Chart
Group by:
Related News


About OSE All Share – Norway 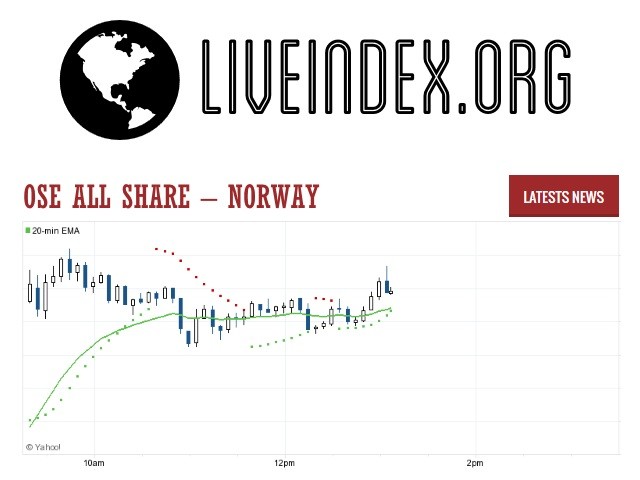
OSEAX is the index of Norway . It is traded in Oslo
OSE All Share - OSE All Share Index | OSE All Share Live Quotes | Netherlands Index
Live Price of OSE All Share. OSE All Share Live Chart, OSE All Share Intraday & Historical Live Chart. OSE All Share Buy Sell Signal, OSE All Share News, OSE All Share Videos, OSE All Share Averages, Returns & Historical Data
» OSE All Share
» OSE All Share Real Time Quotes
» OSE All Share Live Chart
» OSE All Share Intraday Chart
» OSE All Share Historical Chart
» OSE All Share Buy Sell Signal
» OSE All Share News
» OSE All Share Videos
» OSE All Share Averages
» OSE All Share Returns
» OSE All Share Historical Data