
| Symbol | Last | Change | % | High | Low |
|---|---|---|---|---|---|
| NATURAL GAS | 2.6690 | +0.0210 | +0.79% | 2.7150 | 2.6660 |
| Close | GMT Time : Mon Apr 13 2026 04:02 | ||||
Natural Gas : Intraday Live Chart
Natural Gas : Technical Signal Buy & Sell
| 5 Min Signal | 1 Hour Signal | 1 Day Signal |
|---|---|---|
| Sell | Buy | Sell |
Natural Gas : Moving Averages
| Period | MA 20 | MA 50 | MA 100 |
|---|---|---|---|
| 5 Minutes | 2.68 | 2.68 | 2.65 |
| 1 Hour | 2.66 | 2.66 | 2.67 |
| 1 Day | 2.84 | 2.96 | 3.42 |
| 1 Week | 3.82 | 3.53 | 3.28 |
Natural Gas : Technical Resistance Level
| Resistance 1 - R1 | Resistance 2 - R2 | Resistance 3 - r3 |
|---|---|---|
| 2.7077 | 2.7170 | 2.7337 |
Natural Gas : Technical Support Level
| Support 1 - S1 | Support 2 - S2 | Support 3 - S3 |
|---|---|---|
| 2.6817 | 2.6650 | 2.6557 |
Natural Gas : Periodical High, Low & Average
| Period | High Change from Last | Low Change from Last | Average Change from Last |
|---|---|---|---|
| 1 Week | 2.8440 -0.1750 | 2.6280 +0.0410 | 2.7130 -0.0440 |
| 1 Month | 3.3170 -0.6480 | 2.6280 +0.0410 | 2.8957 -0.2267 |
| 3 Month | 7.8270 -5.1580 | 2.6280 +0.0410 | 3.3856 -0.7166 |
| 6 Month | 7.8270 -5.1580 | 2.6280 +0.0410 | 3.7482 -1.0792 |
| 1 Year | 7.8270 -5.1580 | 2.6280 +0.0410 | 3.5049 -0.8359 |
Natural Gas : Historical Chart
Group by:
Related News


About Natural Gas 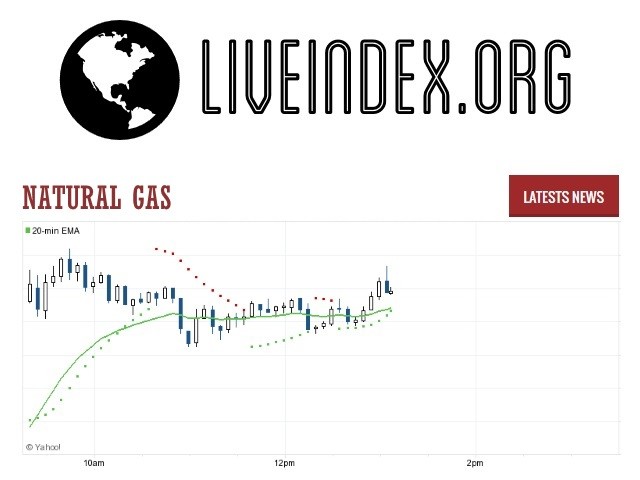
Natural Gas | Natural Gas Prices | Natural Gas Live Quotes | Natural Gas Prices in US Dollar | Natural Gas Live Quotes
Live Price of Natural Gas. Natural Gas Live Chart, Intraday & Historical Chart. Natural Gas Buy & Sell Signal and News & Videos, Natural Gas Averages, Returns & Historical Data
» Natural Gas
» Natural Gas Real Time Quotes
» Natural Gas Live Chart
» Natural Gas Intraday Chart
» Natural Gas Historical Chart
» Natural Gas Buy Sell Signal
» Natural Gas News
» Natural Gas Videos
» Natural Gas Averages
» Natural Gas Currency Pair
» Natural Gas Historical Data