
| Symbol | Last | Change | % | High | Low |
|---|---|---|---|---|---|
| NATURAL GAS | 2.9610 | +0.0360 | +1.23% | 2.9650 | 2.9320 |
| Open Last Trade : 03:38 | GMT Time : Thu Jul 23 2026 03:38 | ||||
Natural Gas : Intraday Live Chart
Natural Gas : Technical Signal Buy & Sell
| 5 Min Signal | 1 Hour Signal | 1 Day Signal |
|---|---|---|
| Buy | Buy | Sell |
Natural Gas : Moving Averages
| Period | MA 20 | MA 50 | MA 100 |
|---|---|---|---|
| 5 Minutes | 2.96 | 2.95 | 2.95 |
| 1 Hour | 2.92 | 2.89 | 2.89 |
| 1 Day | 3.02 | 3.13 | 2.97 |
| 1 Week | 2.96 | 3.41 | 3.35 |
Natural Gas : Technical Resistance Level
| Resistance 1 - R1 | Resistance 2 - R2 | Resistance 3 - r3 |
|---|---|---|
| 2.9467 | 2.9540 | 2.9577 |
Natural Gas : Technical Support Level
| Support 1 - S1 | Support 2 - S2 | Support 3 - S3 |
|---|---|---|
| 2.9357 | 2.9320 | 2.9247 |
Natural Gas : Periodical High, Low & Average
| Period | High Change from Last | Low Change from Last | Average Change from Last |
|---|---|---|---|
| 1 Week | 2.9430 +0.0180 | 2.8390 +0.1220 | 2.8970 +0.0640 |
| 1 Month | 3.4410 -0.4800 | 2.8390 +0.1220 | 3.0860 -0.1250 |
| 3 Month | 3.4410 -0.4800 | 2.4950 +0.4660 | 3.0160 -0.0550 |
| 6 Month | 7.8270 -4.8660 | 2.4950 +0.4660 | 3.1386 -0.1776 |
| 1 Year | 7.8270 -4.8660 | 2.4950 +0.4660 | 3.3709 -0.4099 |
Natural Gas : Historical Chart
Group by:
Related News


About Natural Gas 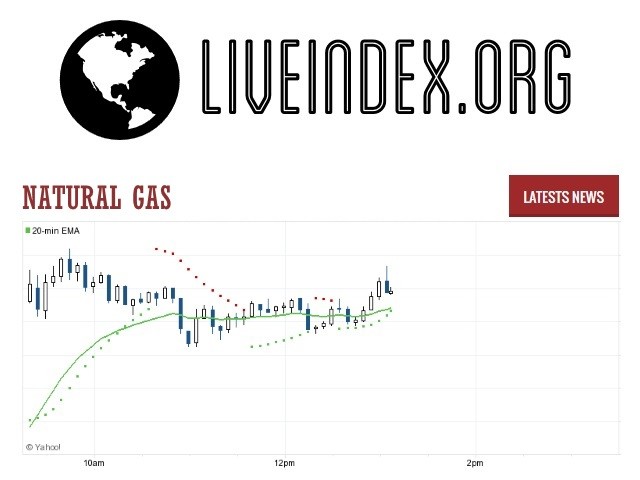
Natural Gas | Natural Gas Prices | Natural Gas Live Quotes | Natural Gas Prices in US Dollar | Natural Gas Live Quotes
Live Price of Natural Gas. Natural Gas Live Chart, Intraday & Historical Chart. Natural Gas Buy & Sell Signal and News & Videos, Natural Gas Averages, Returns & Historical Data
» Natural Gas
» Natural Gas Real Time Quotes
» Natural Gas Live Chart
» Natural Gas Intraday Chart
» Natural Gas Historical Chart
» Natural Gas Buy Sell Signal
» Natural Gas News
» Natural Gas Videos
» Natural Gas Averages
» Natural Gas Currency Pair
» Natural Gas Historical Data