
| Symbol | Last | Change | % | High | Low |
|---|---|---|---|---|---|
| JSE TOP 40 – SOUTH AFRICA | 107,285 | -2,002 | -1.83% | 109,529 | 107,285 |
| Close | South Africa Time : Fri Mar 13 2026 22:03 | ||||
JSE Top 40 : Intraday Live Chart
JSE Top 40 : Technical Signal Buy & Sell
| 5 Min Signal | 1 Hour Signal | 1 Day Signal |
|---|---|---|
| Buy | Sell | Buy |
JSE Top 40 : Moving Averages
| Period | MA 20 | MA 50 | MA 100 |
|---|---|---|---|
| 5 Minutes | 108260.38 | 108196.44 | 108196.44 |
| 1 Hour | 108804.92 | 109421.34 | 109382.37 |
| 1 Day | 114406.57 | 113579.80 | 109909.45 |
| 1 Week | 107111.91 | 94922.52 | 83613.80 |
JSE Top 40 : Technical Resistance Level
| Resistance 1 - R1 | Resistance 2 - R2 | Resistance 3 - r3 |
|---|---|---|
| 110,686 | 112,082 | 113,168 |
JSE Top 40 : Technical Support Level
| Support 1 - S1 | Support 2 - S2 | Support 3 - S3 |
|---|---|---|
| 108,204 | 107,118 | 105,722 |
JSE Top 40 : Periodical High, Low & Average
| Period | High Change from Last | Low Change from Last | Average Change from Last |
|---|---|---|---|
| 1 Week | 112,926 -5,641 | 107,254 +31 | 109,661 -2,376 |
| 1 Month | 121,330 -14,045 | 107,254 +31 | 114,195 -6,910 |
| 3 Month | 121,330 -14,045 | 104,634 +2,651 | 112,235 -4,950 |
| 6 Month | 121,330 -14,045 | 96,524 +10,761 | 107,479 -194 |
| 1 Year | 121,330 -14,045 | 70,516 +36,769 | 96,314 +10,971 |
JSE Top 40 : Historical Chart
Group by:
Related News


About JSE Top 40 – South Africa 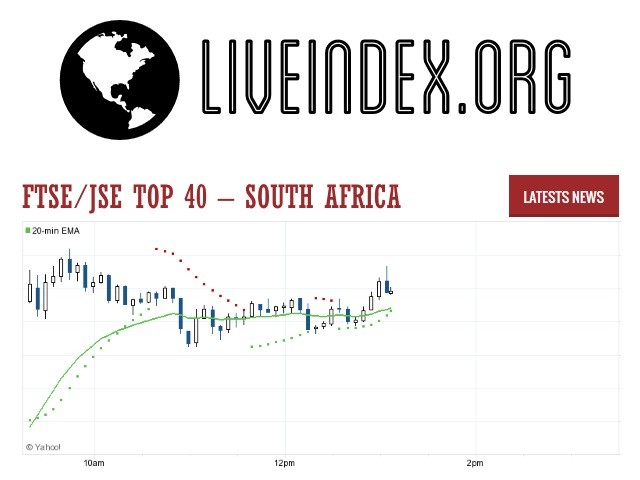
FTSE/JSE Top 40 – South Africa is primary index of South African Stock Exchange
JSE Top 40 - JSE Top 40 Index | JSE Top 40 Live Quotes | South Africa Index
Live Price of JSE Top 40. JSE Top 40 Live Chart, JSE Top 40 Intraday & Historical Live Chart. JSE Top 40 Buy Sell Signal, JSE Top 40 News, JSE Top 40 Videos, JSE Top 40 Averages, Returns & Historical Data
» JSE Top 40
» JSE Top 40 Real Time Quotes
» JSE Top 40 Live Chart
» JSE Top 40 Intraday Chart
» JSE Top 40 Historical Chart
» JSE Top 40 Buy Sell Signal
» JSE Top 40 News
» JSE Top 40 Videos
» JSE Top 40 Averages
» JSE Top 40 Returns
» JSE Top 40 Historical Data