
| Symbol | Last | Change | % | High | Low |
|---|---|---|---|---|---|
| JSE TOP 40 – SOUTH AFRICA | 103,928 | +670 | +0.65% | 104,456 | 103,035 |
| Close | South Africa Time : Mon Aug 03 2026 10:50 | ||||
JSE Top 40 : Intraday Live Chart
JSE Top 40 : Technical Signal Buy & Sell
| 5 Min Signal | 1 Hour Signal | 1 Day Signal |
|---|---|---|
| Neutral | Buy | Sell |
JSE Top 40 : Moving Averages
| Period | MA 20 | MA 50 | MA 100 |
|---|---|---|---|
| 5 Minutes | 103257.69 | 103257.69 | 103257.69 |
| 1 Hour | 103309.01 | 103278.82 | 103308.87 |
| 1 Day | 101850.90 | 102748.99 | 104943.40 |
| 1 Week | 106884.97 | 102951.90 | 90279.76 |
JSE Top 40 : Technical Resistance Level
| Resistance 1 - R1 | Resistance 2 - R2 | Resistance 3 - r3 |
|---|---|---|
| 104,609 | 105,659 | 106,509 |
JSE Top 40 : Technical Support Level
| Support 1 - S1 | Support 2 - S2 | Support 3 - S3 |
|---|---|---|
| 102,709 | 101,859 | 100,809 |
JSE Top 40 : Periodical High, Low & Average
| Period | High Change from Last | Low Change from Last | Average Change from Last |
|---|---|---|---|
| 1 Week | 104,408 -480 | 101,312 +2,616 | 102,828 +1,100 |
| 1 Month | 104,408 -480 | 99,073 +4,855 | 101,949 +1,979 |
| 3 Month | 112,234 -8,306 | 99,073 +4,855 | 104,435 -507 |
| 6 Month | 121,330 -17,402 | 99,073 +4,855 | 107,464 -3,536 |
| 1 Year | 121,330 -17,402 | 89,297 +14,631 | 104,921 -993 |
JSE Top 40 : Historical Chart
Group by:
Related News


About JSE Top 40 – South Africa 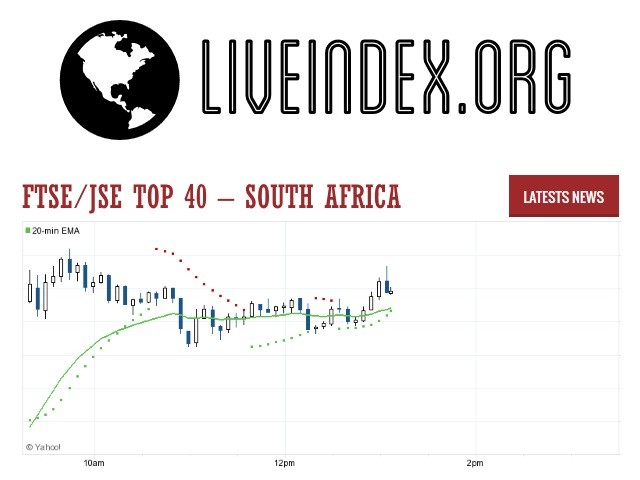
FTSE/JSE Top 40 – South Africa is primary index of South African Stock Exchange
JSE Top 40 - JSE Top 40 Index | JSE Top 40 Live Quotes | South Africa Index
Live Price of JSE Top 40. JSE Top 40 Live Chart, JSE Top 40 Intraday & Historical Live Chart. JSE Top 40 Buy Sell Signal, JSE Top 40 News, JSE Top 40 Videos, JSE Top 40 Averages, Returns & Historical Data
» JSE Top 40
» JSE Top 40 Real Time Quotes
» JSE Top 40 Live Chart
» JSE Top 40 Intraday Chart
» JSE Top 40 Historical Chart
» JSE Top 40 Buy Sell Signal
» JSE Top 40 News
» JSE Top 40 Videos
» JSE Top 40 Averages
» JSE Top 40 Returns
» JSE Top 40 Historical Data