
| Symbol | Last | Change | % | High | Low |
|---|---|---|---|---|---|
| IBVC BURSATIL – VENEZUELA | 64,355.8 | +1,629.0 | +2.60% | 64,629.6 | 64,350.5 |
| Close | Venezuela Time : Sun May 05 2024 13:41 | ||||
IBVC Bursatil : Intraday Live Chart
IBVC Bursatil : Technical Signal Buy & Sell
| 5 Min Signal | 1 Hour Signal | 1 Day Signal |
|---|---|---|
| Neutral | Buy | Buy |
IBVC Bursatil : Moving Averages
| Period | MA 20 | MA 50 | MA 100 |
|---|---|---|---|
| 5 Minutes | 64355.84 | 64355.84 | 64355.84 |
| 1 Hour | 64355.84 | 64073.73 | 63893.13 |
| 1 Day | 63402.27 | 58550.70 | 55377.39 |
| 1 Week | 55820.84 | 47766.62 | 31495.87 |
IBVC Bursatil : Technical Resistance Level
| Resistance 1 - R1 | Resistance 2 - R2 | Resistance 3 - r3 |
|---|---|---|
| 64,357.6 | 64,361.1 | 64,362.9 |
IBVC Bursatil : Technical Support Level
| Support 1 - S1 | Support 2 - S2 | Support 3 - S3 |
|---|---|---|
| 64,352.3 | 64,350.5 | 64,347.0 |
IBVC Bursatil : Periodical High, Low & Average
| Period | High Change from Last | Low Change from Last | Average Change from Last |
|---|---|---|---|
| 1 Week | 64,355.8 +0.0 | 60,723.3 +3,632.5 | 63,073.5 +1,282.3 |
| 1 Month | 66,922.1 -2,566.3 | 57,595.9 +6,759.9 | 62,189.7 +2,166.1 |
| 3 Month | 66,922.1 -2,566.3 | 47,210.2 +17,145.6 | 55,428.6 +8,927.2 |
| 6 Month | 66,922.1 -2,566.3 | 47,210.2 +17,145.6 | 56,210.3 +8,145.5 |
| 1 Year | 66,922.1 -2,566.3 | 31,385.4 +32,970.4 | 47,603.4 +16,752.4 |
IBVC Bursatil : Historical Chart
Group by:
Related News


About IBVC Bursatil – Venezuela 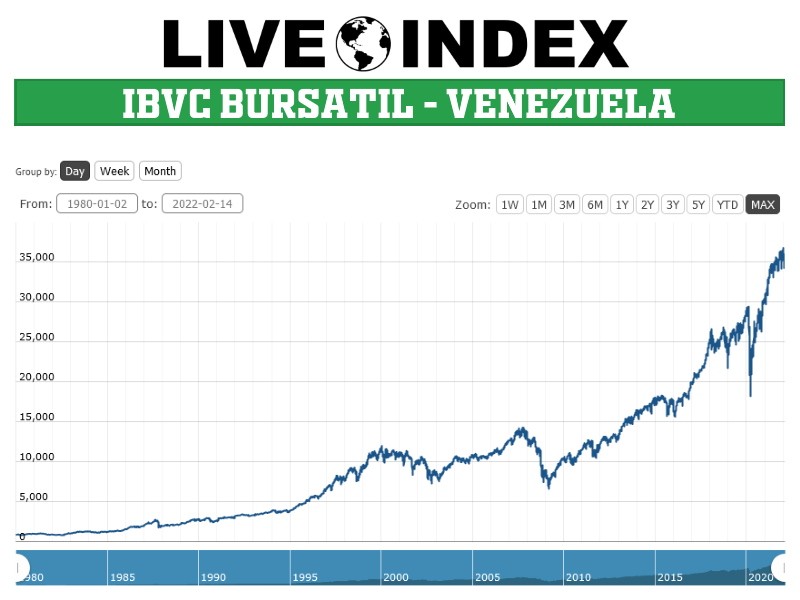
IBVC Bursatil - IBVC Bursatil Index | IBVC Bursatil Live Quotes | Venezuela Index
Live Price of IBVC Bursatil. IBVC Bursatil Live Chart, IBVC Bursatil Intraday & Historical Live Chart. IBVC Bursatil Buy Sell Signal, IBVC Bursatil News, IBVC Bursatil Videos, IBVC Bursatil Averages, Returns & Historical Data
» IBVC Bursatil
» IBVC Bursatil Real Time Quotes
» IBVC Bursatil Live Chart
» IBVC Bursatil Intraday Chart
» IBVC Bursatil Historical Chart
» IBVC Bursatil Buy Sell Signal
» IBVC Bursatil News
» IBVC Bursatil Videos
» IBVC Bursatil Averages
» IBVC Bursatil Returns
» IBVC Bursatil Historical Data