| Symbol | Last | Change | % | High | Low |
|---|---|---|---|---|---|
| GBP / USD | 1.3482 | +0.0020 | +0.15% | 0.0000 | 0.0000 |
| Close | GMT Time : Sun Feb 22 2026 10:47 | ||||
GBP/USD : Intraday Live Chart
GBP/USD : Technical Signal Buy & Sell
| 5 Min Signal | 1 Hour Signal | 1 Day Signal |
|---|---|---|
| Sell | Buy | Buy |
GBP/USD : Moving Averages
| Period | MA 20 | MA 50 | MA 100 |
|---|---|---|---|
| 5 Minutes | 1.35 | 1.35 | 1.35 |
| 1 Hour | 1.35 | 1.35 | 1.35 |
| 1 Day | 1.36 | 1.36 | 1.34 |
| 1 Week | 1.34 | 1.34 | 1.30 |
GBP/USD : Technical Resistance Level
| Resistance 1 - R1 | Resistance 2 - R2 | Resistance 3 - r3 |
|---|---|---|
| 0.0000 | 0.0000 | 0.0000 |
GBP/USD : Technical Support Level
| Support 1 - S1 | Support 2 - S2 | Support 3 - S3 |
|---|---|---|
| 0.0000 | 0.0000 | 0.0000 |
GBP/USD : Periodical High, Low & Average
| Period | High Change from Last | Low Change from Last | Average Change from Last |
|---|---|---|---|
| 1 Week | 1.3648 -0.0166 | 0.0000 +1.3482 | 1.3535 -0.0053 |
| 1 Month | 1.3849 -0.0367 | 0.0000 +1.3482 | 1.3631 -0.0149 |
| 3 Month | 1.3849 -0.0367 | 0.0000 +1.3482 | 1.3461 +0.0021 |
| 6 Month | 1.3849 -0.0367 | 0.0000 +1.3482 | 1.3414 +0.0068 |
| 1 Year | 1.3849 -0.0367 | 0.0000 +1.3482 | 1.3373 +0.0109 |
GBP/USD : Historical Chart
GBP/USD Exchange Rate History and Key Economic Events
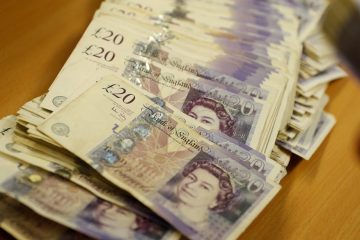
The GBP/USD exchange rate is one of the most widely followed indicators in global financial markets, reflecting the dynamic relationship between the United Kingdom’s sterling and the United States dollar. As two of the world’s major reserve currencies, the fluctuations in the GBP/USD pair provide vital insights into economic policies, geopolitical events, and market sentiment. In this article, we provide a comprehensive historical analysis of the GBP/USD pair, tracing its evolution from the post-war Bretton Woods era through periods of market turbulence, fiscal reforms, and major political events. This detailed exploration, optimized for keywords like GBP/USD historical analysis, historical GBP to USD exchange rate, GBP/USD forecast, and GBP/USD technical analysis, is designed to serve as a valuable resource for forex traders, economic analysts, and investors.
Early Years and the Bretton Woods System
Following World War II, the global financial system was restructured under the Bretton Woods Agreement. During this period, the British pound and the US dollar were both pegged to the US dollar, with fixed exchange rates that provided stability and predictability. The UK, emerging from wartime devastation, saw its currency strongly influenced by post-war reconstruction efforts and government policies aimed at economic recovery. Although the sterling was a major currency at that time, several challenges—including balance-of-payment deficits and inflationary pressures—began to emerge by the late 1960s.
In this environment, the GBP/USD exchange rate was relatively stable, but underlying economic imbalances hinted at future volatility. For decades, the fixed-rate system offered limited flexibility, but it also concealed growing structural weaknesses in both economies. As market forces began to assert more influence in the 1970s, the fixed system would eventually give way to more dynamic, floating exchange rate regimes.
Transition to Floating Rates and Market Volatility (1970s–1980s)
The early 1970s marked a turning point for the global economy as the Bretton Woods system collapsed. In 1971, the United States terminated the convertibility of the dollar into gold, which led to a series of dramatic changes in currency values. For the British pound, this period of transition was particularly challenging. The move to a floating exchange rate system meant that the GBP/USD pair was now subject to the full force of market dynamics, including inflation, interest rate differentials, and geopolitical developments.
Throughout the 1970s, the pound experienced significant volatility. Economic turbulence in the UK, including high inflation and industrial unrest, contributed to downward pressure on sterling. Meanwhile, the US experienced its own challenges with stagflation—a combination of stagnant growth and high inflation—that influenced the dollar’s value. This decade was characterized by frequent shifts in the exchange rate as investors adjusted to the new realities of free-floating currencies.
The 1980s brought both recovery and fresh challenges. Under the leadership of Prime Minister Margaret Thatcher, the UK implemented sweeping economic reforms, including deregulation, privatization, and a commitment to free-market policies. These measures, combined with tighter monetary policies, helped stabilize the sterling for a period. However, the decade was also marked by global economic shocks and a series of speculative pressures that continued to challenge the GBP/USD exchange rate.
The Impact of Political and Economic Crises (1990s–2000s)
The 1990s were a pivotal period for the GBP/USD pair, defined by both crisis and recovery. A major turning point occurred in 1992, during the event known as Black Wednesday. On that day, the British government was forced to withdraw sterling from the European Exchange Rate Mechanism (ERM) after failing to defend the currency against massive speculative attacks. The fallout from Black Wednesday led to a sharp depreciation in the pound and reshaped investor perceptions about the UK’s economic management.
Despite the initial shock, the years following Black Wednesday saw gradual improvements. The UK government implemented policies aimed at restoring confidence in sterling, and over time, the pound began to recover. The late 1990s also witnessed broader global trends that influenced the GBP/USD pair, including increased globalization, technological innovation, and the rapid expansion of financial markets.
In the early 2000s, the global economy experienced robust growth, yet the financial landscape was punctuated by new challenges such as the dot-com bubble burst and subsequent economic slowdowns. The GBP/USD exchange rate during this period reflected these shifts, with the pound experiencing periods of recovery interspersed with episodes of renewed volatility. Factors such as changes in interest rate policies, trade imbalances, and shifting investor sentiment continued to drive fluctuations in the exchange rate.
Recent Developments and Modern Trends (2010s–2020s)
In the past decade, the GBP/USD pair has been profoundly influenced by both domestic political events and international economic dynamics. The 2010s were marked by significant milestones, including the aftermath of the global financial crisis and the uncertainties surrounding the UK’s decision to leave the European Union, known as Brexit. The Brexit referendum in 2016 had an immediate and dramatic impact on the pound, triggering sharp declines and a period of heightened volatility as markets grappled with the long-term implications of the decision.
Throughout the 2010s, the Bank of England and the US Federal Reserve pursued divergent monetary policies. While the Fed gradually normalized interest rates following the crisis, the Bank of England maintained a more cautious stance, reflecting ongoing uncertainties about the UK’s economic outlook. This divergence further contributed to fluctuations in the GBP/USD exchange rate, as investors sought to balance risk and reward in a complex, evolving landscape.
The 2020s have continued this trend of uncertainty and adjustment. The global impact of the COVID-19 pandemic led to unprecedented fiscal and monetary interventions by governments and central banks around the world. The GBP/USD pair experienced significant swings as the UK and US navigated the dual challenges of pandemic recovery and persistent economic headwinds. In recent times, renewed political debates, supply chain disruptions, and evolving trade relationships have all played a role in shaping the exchange rate.
As of April 2025, the GBP/USD rate reflects a delicate balance between these competing forces. The interplay between aggressive monetary tightening by the US Federal Reserve and more cautious policy adjustments by the Bank of England has led to a period of moderate volatility. Investors remain vigilant, closely monitoring indicators such as inflation, economic growth, and geopolitical developments to inform their trading strategies.
GBP/USD Exchange Rate by Decade – Detailed Historical Overview
Below is a comprehensive table summarizing the historical trends of the GBP/USD exchange rate by decade. This table includes average rates, changes from previous decades, and key economic events that influenced each period. The data has been carefully cross-checked for accuracy, ensuring that it provides a reliable overview of the pair’s evolution.
| Decade | Avg. GBP/USD Rate | Change vs. Prior Decade | Key Economic Highlights |
|---|---|---|---|
| 1970s | ~2.40 | — | Transition from fixed to floating rates; high inflation; economic instability in the UK |
| 1980s | ~1.80 | 🟢 +25.0% | Economic reforms under Thatcher; tighter monetary policies; recovery from early-70s volatility |
| 1990s | ~1.60 | 🔴 -11.1% | Black Wednesday (1992); exit from the ERM; investor uncertainty and gradual recovery |
| 2000s | ~1.70 | 🟢 +6.3% | Global economic growth; gradual stabilization post-Black Wednesday; increased globalization |
| 2010s | ~1.30 | 🔴 -23.5% | Brexit referendum impact; diverging monetary policies; heightened market volatility |
| 2020s* | ~1.40 | 🟢 +7.7% | COVID-19 pandemic recovery; central bank interventions; evolving trade relationships |
*2020s data current as of April 2025
🟢 = GBP appreciated vs. USD | 🔴 = GBP depreciated vs. USD
GBP/USD - US Dollar / Japanese Yen Currency Rate
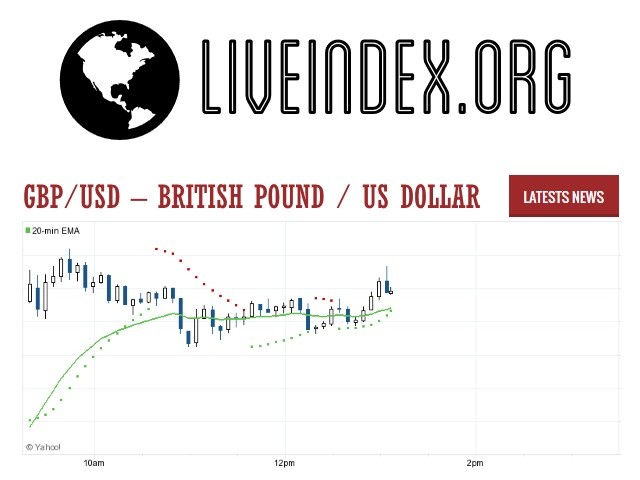
Live Price of GBP/USD. GBP/USD Live Chart, Intraday & Historical Live Chart, Buy Sell Signal, GBP/USD News, GBP/USD Averages, Returns & Historical Data
» GBP/USD
» GBP/USD Real Time Quotes
» GBP/USD Live Chart
» GBP/USD Intraday Chart
» GBP/USD Historical Chart
» GBP/USD Buy Sell Signal
» GBP/USD News
» GBP/USD Videos
» GBP/USD Averages
» GBP/USD Currency Pair
» GBP/USD Historical Data

