
| Symbol | Last | Change | % | High | Low |
|---|---|---|---|---|---|
| OMX 20 – SWEDEN | 1,005.76 | +6.25 | +0.63% | 1,014.39 | 1,002.94 |
| Open Last Trade : 13:18 | Norway Time : Mon Apr 13 2026 13:20 | ||||
OMX Oslo 20 : Intraday Live Chart
OMX Oslo 20 : Technical Signal Buy & Sell
| 5 Min Signal | 1 Hour Signal | 1 Day Signal |
|---|---|---|
| Neutral | Buy | Buy |
OMX Oslo 20 : Moving Averages
| Period | MA 20 | MA 50 | MA 100 |
|---|---|---|---|
| 5 Minutes | 1008.15 | 1008.15 | 1008.15 |
| 1 Hour | 1001.08 | 1000.15 | 1002.40 |
| 1 Day | 964.14 | 925.89 | 869.62 |
| 1 Week | 851.75 | 804.44 | 758.15 |
OMX Oslo 20 : Technical Resistance Level
| Resistance 1 - R1 | Resistance 2 - R2 | Resistance 3 - r3 |
|---|---|---|
| 1,016.80 | 1,028.59 | 1,033.64 |
OMX Oslo 20 : Technical Support Level
| Support 1 - S1 | Support 2 - S2 | Support 3 - S3 |
|---|---|---|
| 999.96 | 994.91 | 983.12 |
OMX Oslo 20 : Periodical High, Low & Average
| Period | High Change from Last | Low Change from Last | Average Change from Last |
|---|---|---|---|
| 1 Week | 1,032.36 -26.60 | 981.83 +23.93 | 1,004.65 +1.11 |
| 1 Month | 1,032.36 -26.60 | 943.77 +61.99 | 980.62 +25.14 |
| 3 Month | 1,032.36 -26.60 | 819.28 +186.48 | 904.56 +101.20 |
| 6 Month | 1,032.36 -26.60 | 767.80 +237.96 | 854.83 +150.93 |
| 1 Year | 1,032.36 -26.60 | 696.90 +308.86 | 811.35 +194.41 |
OMX Oslo 20 : Historical Chart
Group by:
Related News


About OMX 20 – Sweden 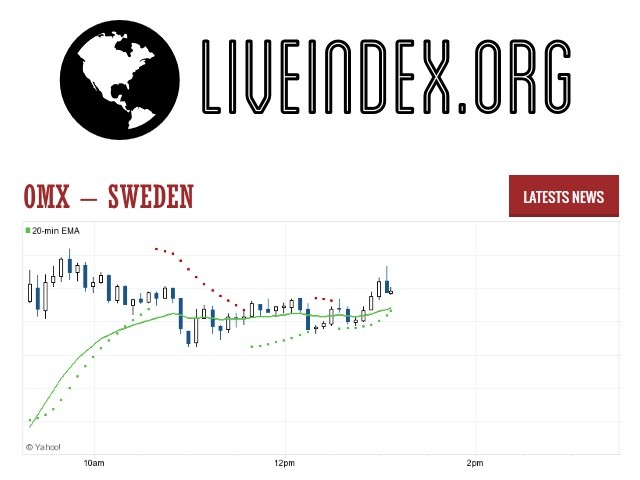
OMX 20 - OMX 20 Index | OMX 20 Live Quotes | Sweden Index
Live Price of OMX 20. OMX 20 Live Chart, OMX 20 Intraday & Historical Live Chart. OMX 20 Buy Sell Signal, OMX 20 News, OMX 20 Videos, OMX 20 Averages, Returns & Historical Data
» OMX 20
» OMX 20 Real Time Quotes
» OMX 20 Live Chart
» OMX 20 Intraday Chart
» OMX 20 Historical Chart
» OMX 20 Buy Sell Signal
» OMX 20 News
» OMX 20 Videos
» OMX 20 Averages
» OMX 20 Returns
» OMX 20 Historical Data