
| Symbol | Last | Change | % | High | Low |
|---|---|---|---|---|---|
| OMX 20 – SWEDEN | 955.46 | +2.44 | +0.26% | 957.61 | 949.94 |
| Open Last Trade : 14:51 | Norway Time : Fri Jul 31 2026 14:51 | ||||
OMX Oslo 20 : Intraday Live Chart
OMX Oslo 20 : Technical Signal Buy & Sell
| 5 Min Signal | 1 Hour Signal | 1 Day Signal |
|---|---|---|
| Buy | Buy | Buy |
OMX Oslo 20 : Moving Averages
| Period | MA 20 | MA 50 | MA 100 |
|---|---|---|---|
| 5 Minutes | 955.88 | 955.69 | 955.69 |
| 1 Hour | 953.24 | 951.40 | 946.46 |
| 1 Day | 932.35 | 926.38 | 944.21 |
| 1 Week | 946.05 | 862.18 | 796.71 |
OMX Oslo 20 : Technical Resistance Level
| Resistance 1 - R1 | Resistance 2 - R2 | Resistance 3 - r3 |
|---|---|---|
| 954.11 | 957.39 | 962.03 |
OMX Oslo 20 : Technical Support Level
| Support 1 - S1 | Support 2 - S2 | Support 3 - S3 |
|---|---|---|
| 946.19 | 941.55 | 938.27 |
OMX Oslo 20 : Periodical High, Low & Average
| Period | High Change from Last | Low Change from Last | Average Change from Last |
|---|---|---|---|
| 1 Week | 955.47 -0.01 | 935.48 +19.98 | 947.78 +7.68 |
| 1 Month | 955.47 -0.01 | 895.25 +60.21 | 926.65 +28.81 |
| 3 Month | 989.53 -34.07 | 895.25 +60.21 | 942.02 +13.44 |
| 6 Month | 1,032.36 -76.90 | 837.77 +117.69 | 939.43 +16.03 |
| 1 Year | 1,032.36 -76.90 | 767.80 +187.66 | 872.08 +83.38 |
OMX Oslo 20 : Historical Chart
Group by:
Related News


About OMX 20 – Sweden 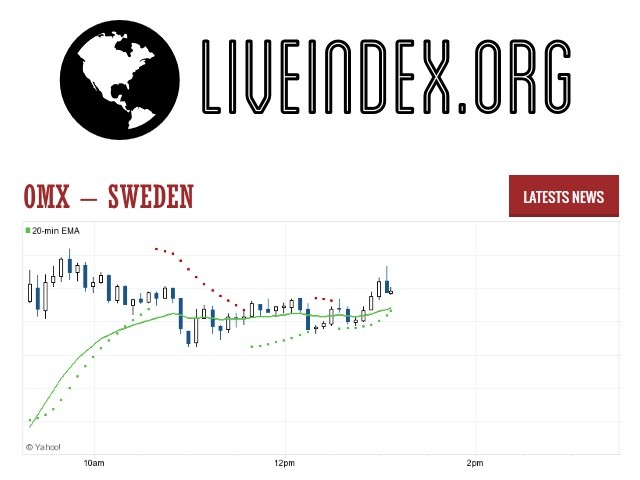
OMX 20 - OMX 20 Index | OMX 20 Live Quotes | Sweden Index
Live Price of OMX 20. OMX 20 Live Chart, OMX 20 Intraday & Historical Live Chart. OMX 20 Buy Sell Signal, OMX 20 News, OMX 20 Videos, OMX 20 Averages, Returns & Historical Data
» OMX 20
» OMX 20 Real Time Quotes
» OMX 20 Live Chart
» OMX 20 Intraday Chart
» OMX 20 Historical Chart
» OMX 20 Buy Sell Signal
» OMX 20 News
» OMX 20 Videos
» OMX 20 Averages
» OMX 20 Returns
» OMX 20 Historical Data